


Dynamic range, noise floor, and input range describe different limits of a data acquisition system. Input range sets the maximum measurable signal, input-referred noise constrains the minimum resolvable signal, and dynamic range expresses the span between them. This article explains how to compare these specifications under consistent measurement conditions.
In the specification sheets of data acquisition system, professional sound cards, and audio analyzers, dynamic range, noise floor, and input range are typically core specifications. However, when selecting equipment and designing measurement schemes, comparing only a single number can often lead to incomplete or even erroneous conclusions.
For instance, a device with a higher dynamic range is not necessarily more suitable for measuring weak signals; after switching the same signal to a smaller input range, the input-referred noise can significantly decrease; and even if two devices have the same dynamic range, their absolute measurement upper and lower limits can be completely different.
The input range determines the measurement upper limit, the input-referred noise floor constrains the measurement lower limit, and the dynamic range describes the ratio span between them.
Input Range and Maximum Signal Level
The input range is the allowable input voltage range of the acquisition channel before the analog front-end saturates and the ADC clips. Common ranges include ±10 V, ±1 V, and ±100 mV, etc. The upper limit in the specification may be marked as peak, peak-to-peak, or RMS; these must be unified before comparison.
When the input signal exceeds the allowed range, the analog front-end or ADC will saturate, leading to waveform clipping. At this point, measurements of peak value, RMS, THD, THD+N, and spectrum analysis can all become distorted.
A larger input range is not always better. A larger range can accommodate stronger signals and reduce the risk of overload; in systems where the front-end gain adjusts with the range, a smaller range allows weaker signals to better utilize the ADC's range and may reduce the input-referred noise. For example, using the peak scale, a 10 mV signal in the ±10 V and ±100 mV ranges occupies approximately 0.1% and 10% of the positive range limit, respectively.
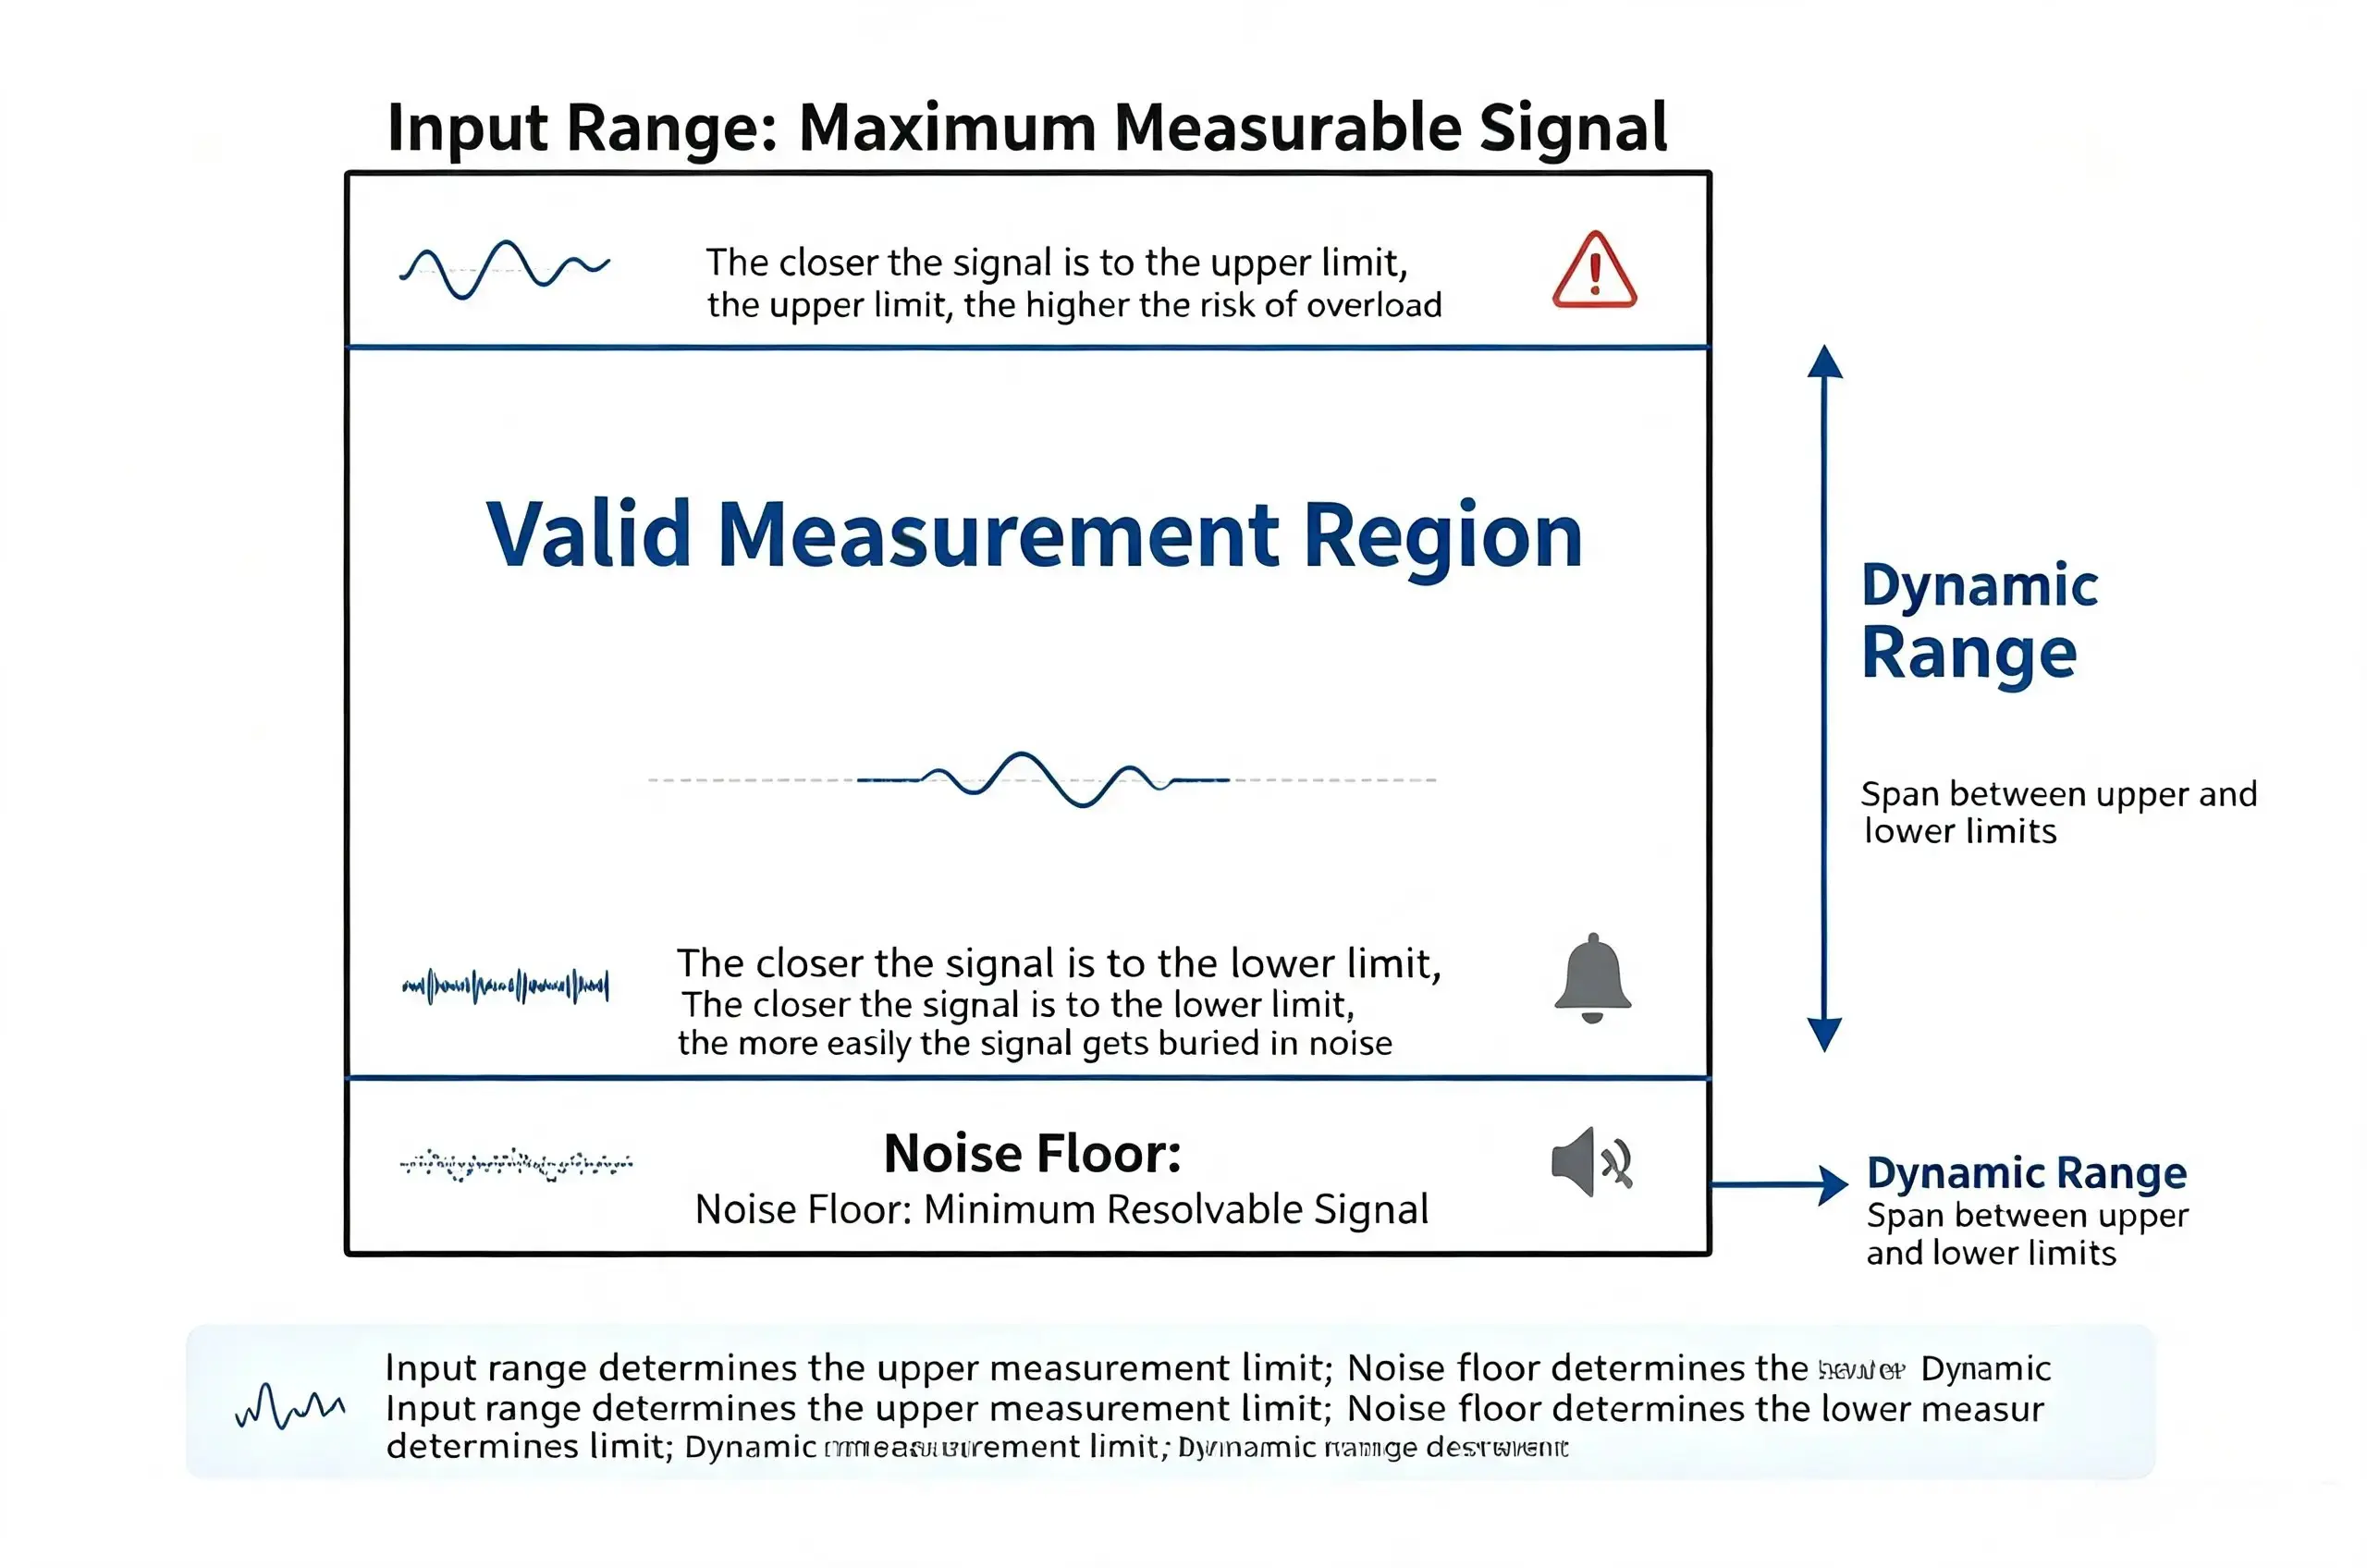
Figure 1_ Relationship between Input Range, Input-Referred Noise Floor, and Dynamic Range
Noise Floor and Minimum Resolvable Signal
Even with no effective signal at the data acquisition system input, the output will not be absolutely zero. Analog amplifiers, resistors, ADCs, power supplies, clocks, and signal conditioning circuits all generate noise, which collectively forms the system's noise floor under specified test conditions.
The noise floor is commonly expressed in µV RMS or nV RMS, nV/√Hz, dBV, and dBFS. Among these, RMS voltage represents the input-referred noise integrated over a specified bandwidth, nV/√Hz represents the noise spectral density, and dBFS represents the noise level relative to the digital full scale.
dBFS is a relative value and cannot be understood independently of the full-scale voltage. If two devices have a noise floor of -120 dBFS under the same bandwidth and test conditions, but 0 dBFS corresponds to 10 Vrms for one device and 1 Vrms for the other, the input-referred noise of the former is typically higher.
Therefore, seeing only "-120 dB" is not sufficient to judge a device's performance. You should also confirm the unit, input range, definition of 0 dBFS, measurement bandwidth, filtering or weighting method, input termination, and whether IEPE is enabled. For broadband random noise, a wider integration bandwidth generally results in higher total RMS noise.
Dynamic Range as Measurement Span
Different manufacturers and test standards may define dynamic range differently. A common engineering interpretation is the ratio of the maximum undistorted signal to the input-referred RMS noise, measured under the same amplitude scale and test conditions:
DR = 20 log₁₀(Vmax / Vnoise)
Assume a channel has a maximum effective input of 10 Vrms and an input-referred noise of 10 µVrms; its dynamic range is then 120 dB, corresponding to a voltage ratio of approximately 1,000,000 times. In the calculation, Vmax and Vnoise must use consistent peak or RMS scales and correspond to the same bandwidth, filtering, and input conditions.
However, dynamic range is essentially a ratio. It only indicates the span between the upper and lower limits and does not independently provide the absolute measurement lower limit.
| System | Maximum Input | Input Noise Floor | Dynamic Range |
|---|---|---|---|
| System A | 10 Vrms | 10 µVrms | 120 dB |
| System B | 1 Vrms | 1 µVrms | 120 dB |
The two systems have the same dynamic range, but System A has a higher measurement upper limit, suitable for larger signals, while System B has a lower absolute noise floor, making it better for weak signals.
Same dynamic range does not imply the same absolute noise floor or weak-signal measurement capability.
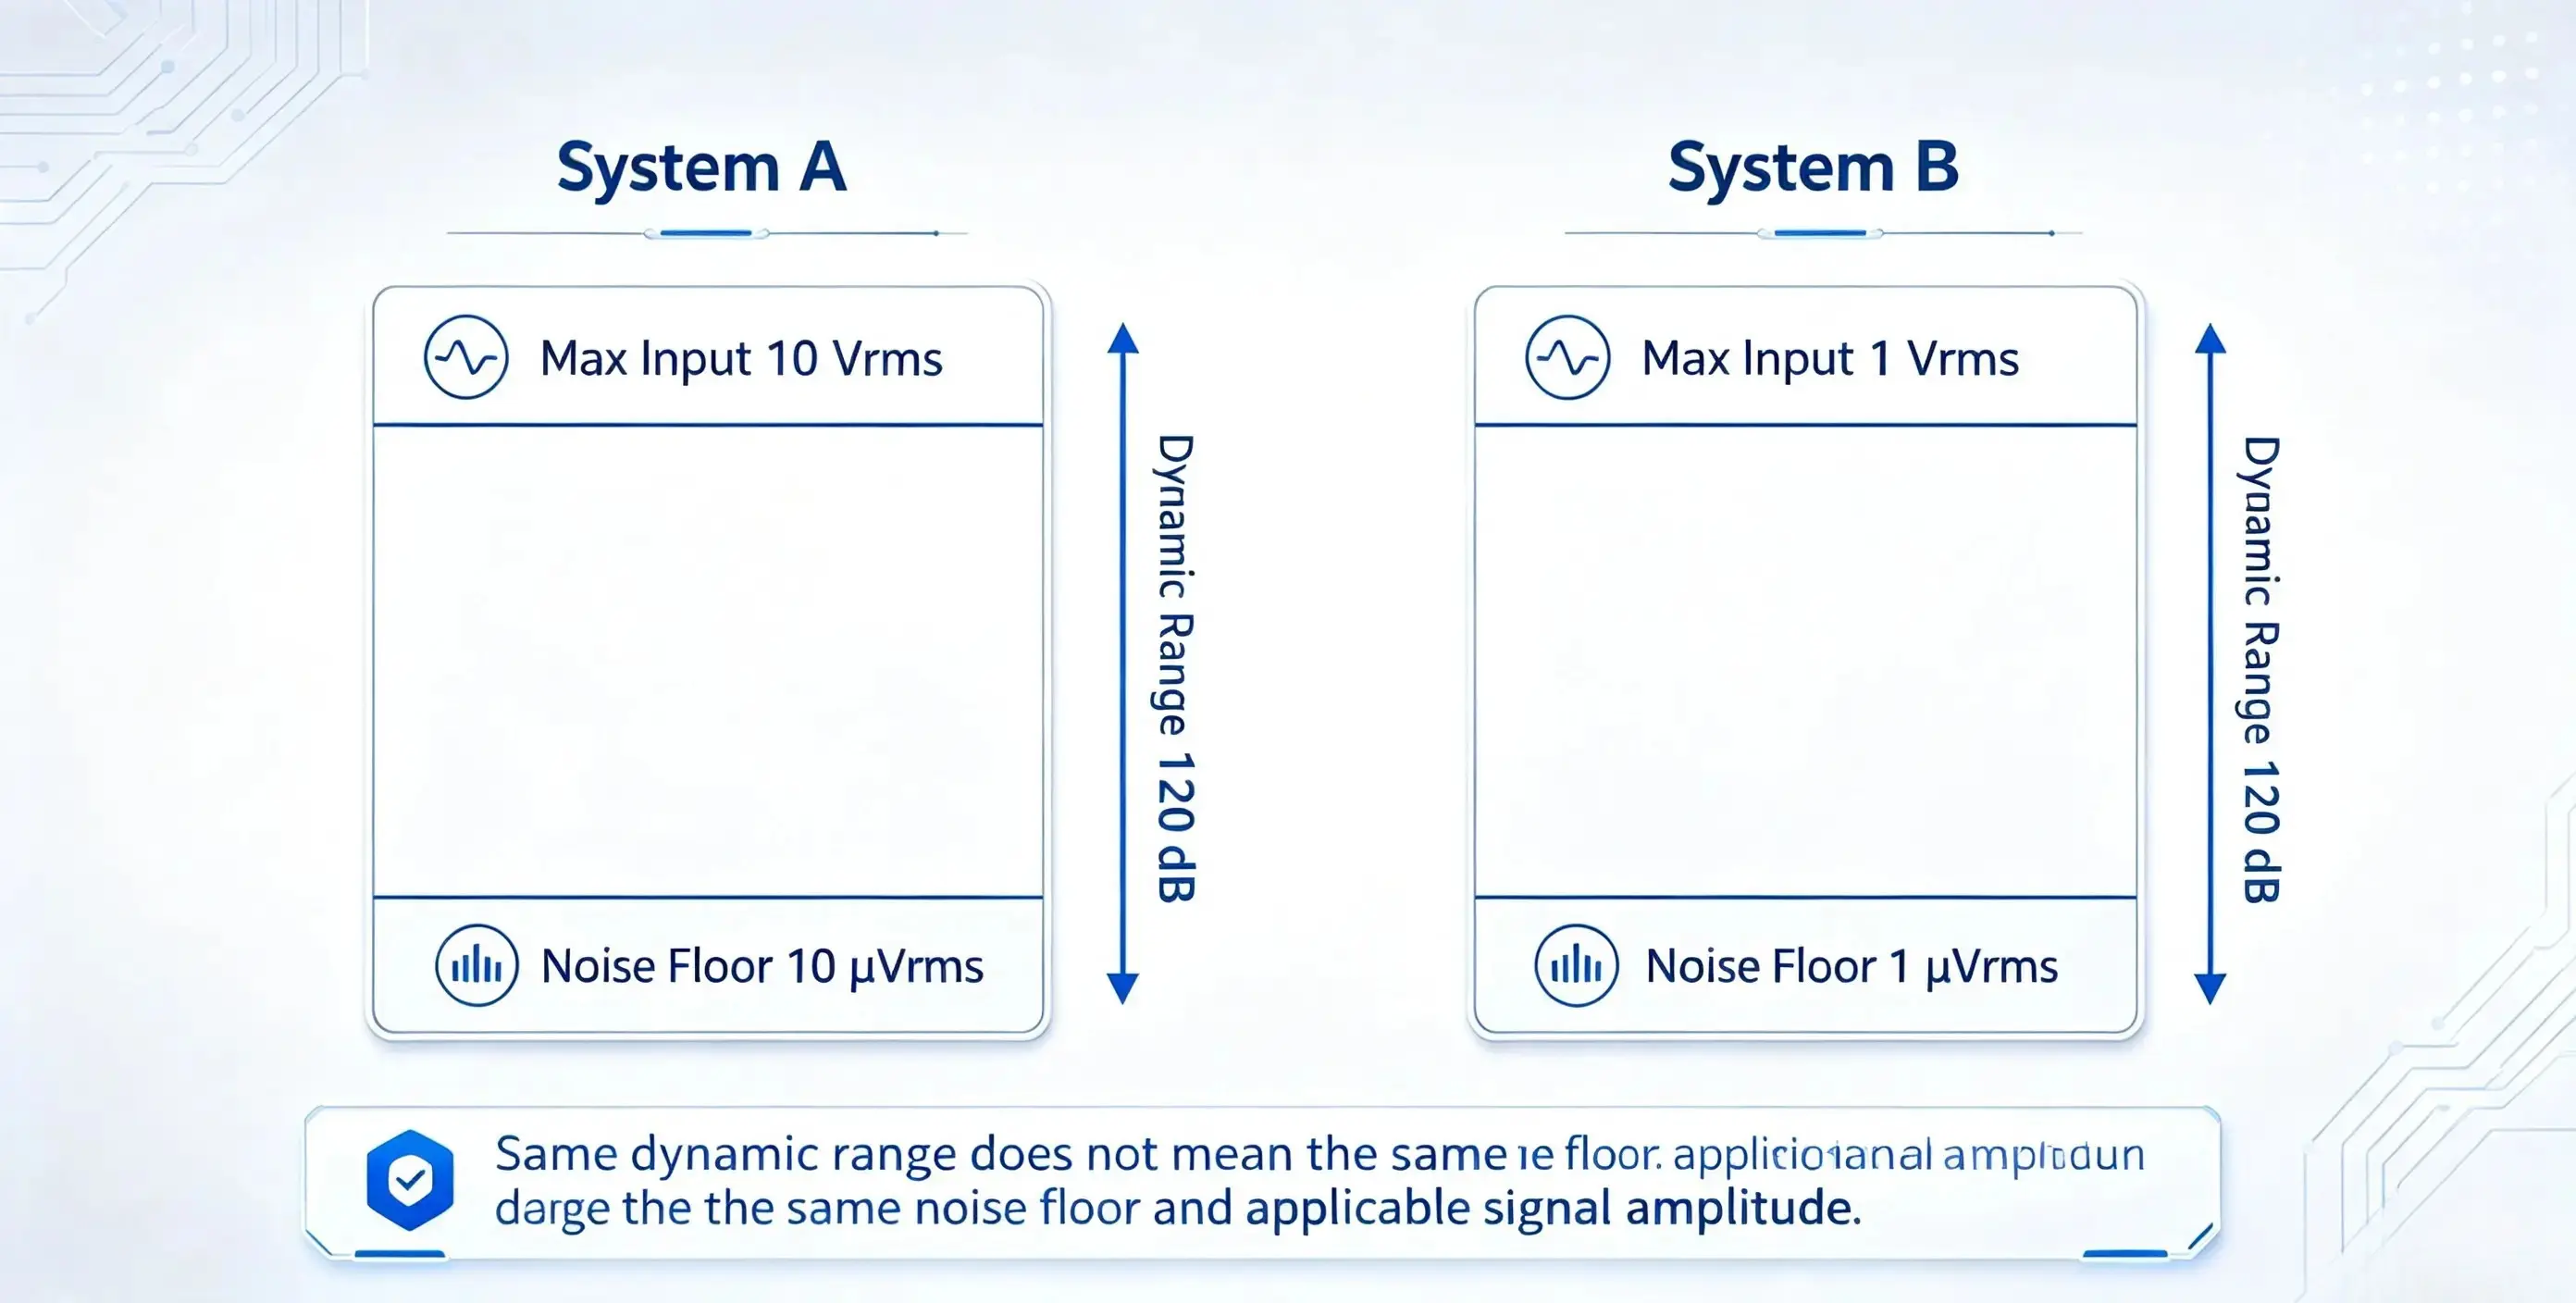
Figure 2_Same Dynamic Range Does Not Mean the Same Absolute Measurement Capability
Why Input Range Affects the Noise Floor
Data acquisition systems with selectable input ranges typically change the input range by switching front-end attenuation or gain. When switching from a ±10 V range to a ±1 V range, the system generally reduces attenuation or increases front-end gain, allowing weaker signals to better utilize the ADC's range. If this gain is placed before the dominant noise source, the noise referred to the input typically decreases.
The following serves as an illustrative example: If the voltage references for 0 dBFS are 10 V, 1 V, and 0.1 V respectively, and the relative noise is consistently -120 dBFS, the input-referred noises are approximately 10 µV, 1 µV, and 0.1 µV. Actual conversion must be based on the manufacturer's definition of 0 dBFS, peak/RMS scale, and measurement bandwidth.
The change in a real device will not perfectly follow this proportion. High-gain amplifiers, range-switching circuits, and protection devices also introduce noise. Therefore, proper product documentation should provide the input-referred noise, dynamic range, and THD+N for each range under consistent test conditions, rather than listing only a single best value.
Table 1_ Comparison of Noise Floor Levels at Different Ranges
| 0 dBFS Voltage Reference | Relative Noise | Input-Referred Noise |
|---|---|---|
| 10 V | -120 dBFS | Approx. 10 µV |
| 1 V | -120 dBFS | Approx. 1 µV |
| 0.1 V | -120 dBFS | Approx. 0.1 µV |
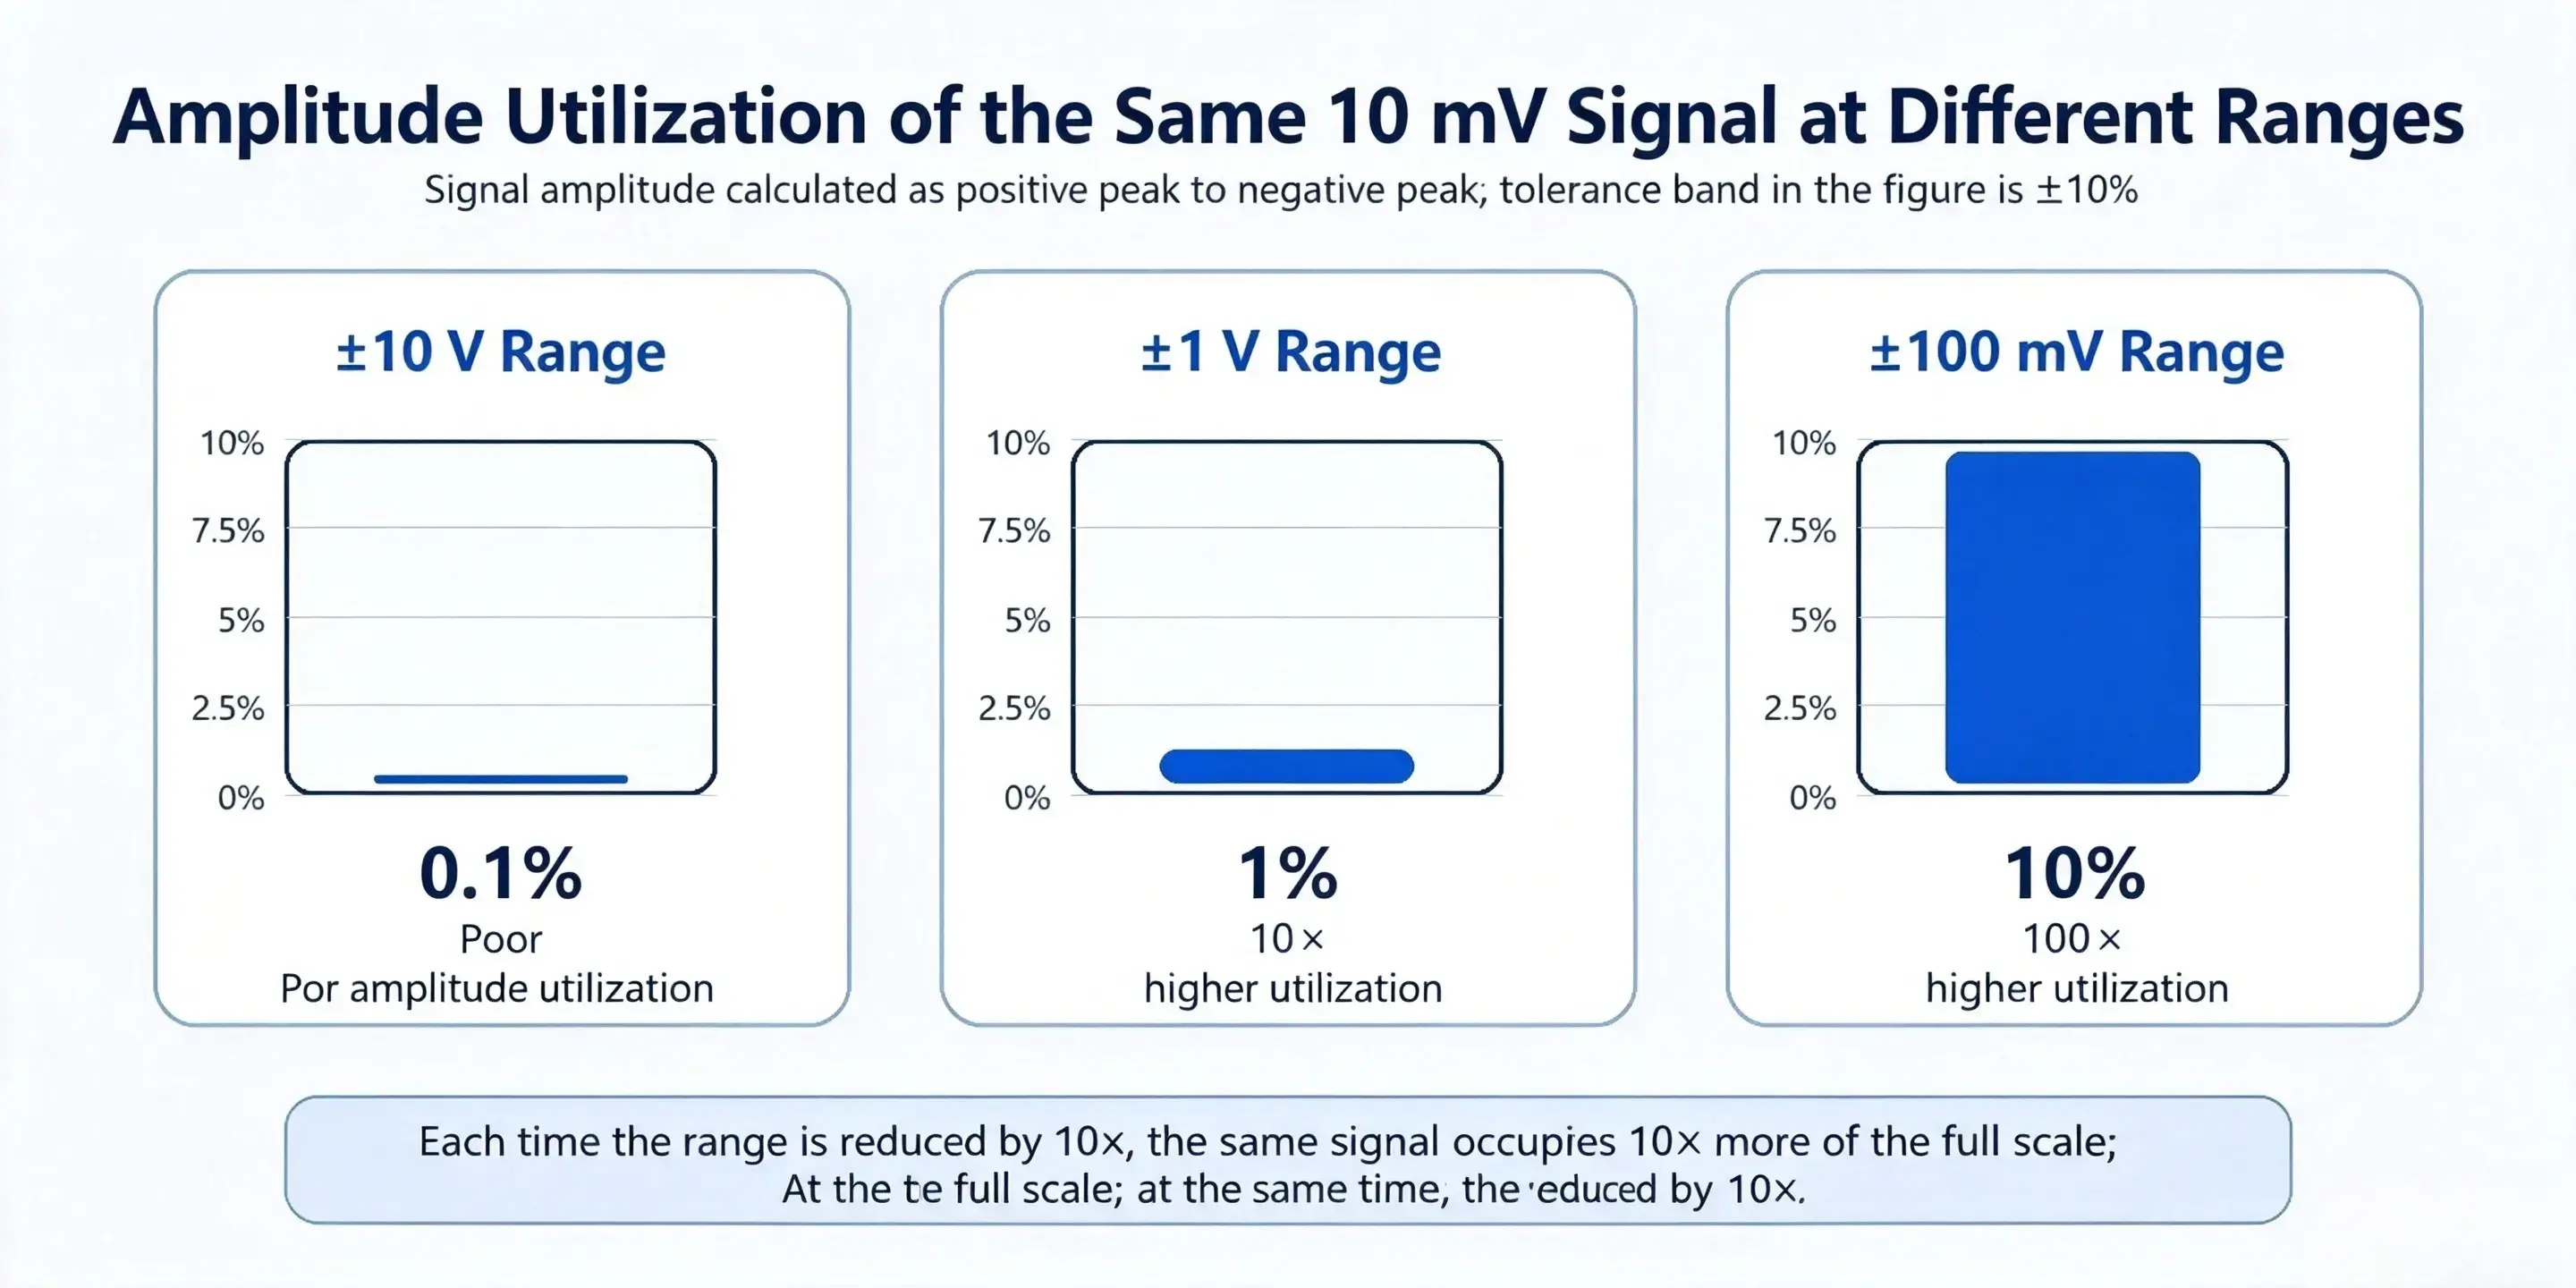
Figure 3_ Amplitude Utilization of the Same 10 mV Signal at Different Input Ranges (Peak Scale)
Does a Smaller Range Increase Dynamic Range?
Not necessarily. If the range is reduced by a factor of 10, and the input-referred noise decreases by a factor of 10 simultaneously, the ratio between the maximum signal and the noise remains unchanged, and the dynamic range stays the same.
For example, a maximum effective input of 10 Vrms and an input-referred noise of 10 µVrms yields a dynamic range of 120 dB; a maximum effective input of 1 Vrms and an input-referred noise of 1 µVrms also yields a dynamic range of 120 dB. The ratios are identical, but the latter has a lower absolute measurement lower limit, making it more suitable for weak signal testing.
The range cannot be reduced indefinitely. An overly small range increases the risk of overload, especially in conditions involving shocks, start-stop events, collisions, and speed changes, where transient peaks can be significantly higher than the normal RMS value.
A smaller range may not improve the specified dynamic range, but with a properly designed front-end, it can typically reduce the input-referred noise and improve weak signal measurement capability.
24-Bit ADCs Do Not Guarantee 146 dB
For an ideal N-bit ADC, under full-scale sinusoidal input and considering only quantization noise, the quantization signal-to-noise ratio can be approximated as:
SNR ≈ 6.02N + 1.76 dB
According to this formula, a 24-bit ADC has a theoretical quantization SNR of approximately 146 dB. However, a real acquisition system is also affected by analog front-end noise, ADC thermal noise, clock jitter, power supply interference, and non-linear distortion.
Therefore, 24 bits is only the digital encoding resolution and cannot be directly equated to a 146 dB system dynamic range. When evaluating a device, one should distinguish between the ADC's stated number of bits, the ADC chip performance, the input module performance, the overall system performance, and the input-referred noise and Effective Number of Bits (ENOB) at each range.
Convert Sensor Noise to Engineering Units
In acoustic and vibration testing, the ultimate concern is not the few microvolts of voltage noise itself, but the corresponding sound pressure, acceleration, or other engineering units it represents.
Assume a microphone sensitivity of 50 mV/Pa and an input-referred noise from the data acquisition system of 1 µV. The equivalent sound pressure noise contributed solely by the acquisition card is 20 µPa, corresponding to a reference sound pressure of 0 dB SPL. The actual system lower limit also depends on the microphone's self-noise, preamplifier noise, and environmental background noise, and should be evaluated comprehensively based on the noise superposition relationship.
For an accelerometer with a sensitivity of 100 mV/g, an acquisition card input-referred noise of 1 µV corresponds to approximately 10 µg. This value only represents the noise contribution of the acquisition card; the final measurement lower limit should be judged in conjunction with the sensor's self-noise, signal conditioning gain, and measurement bandwidth.
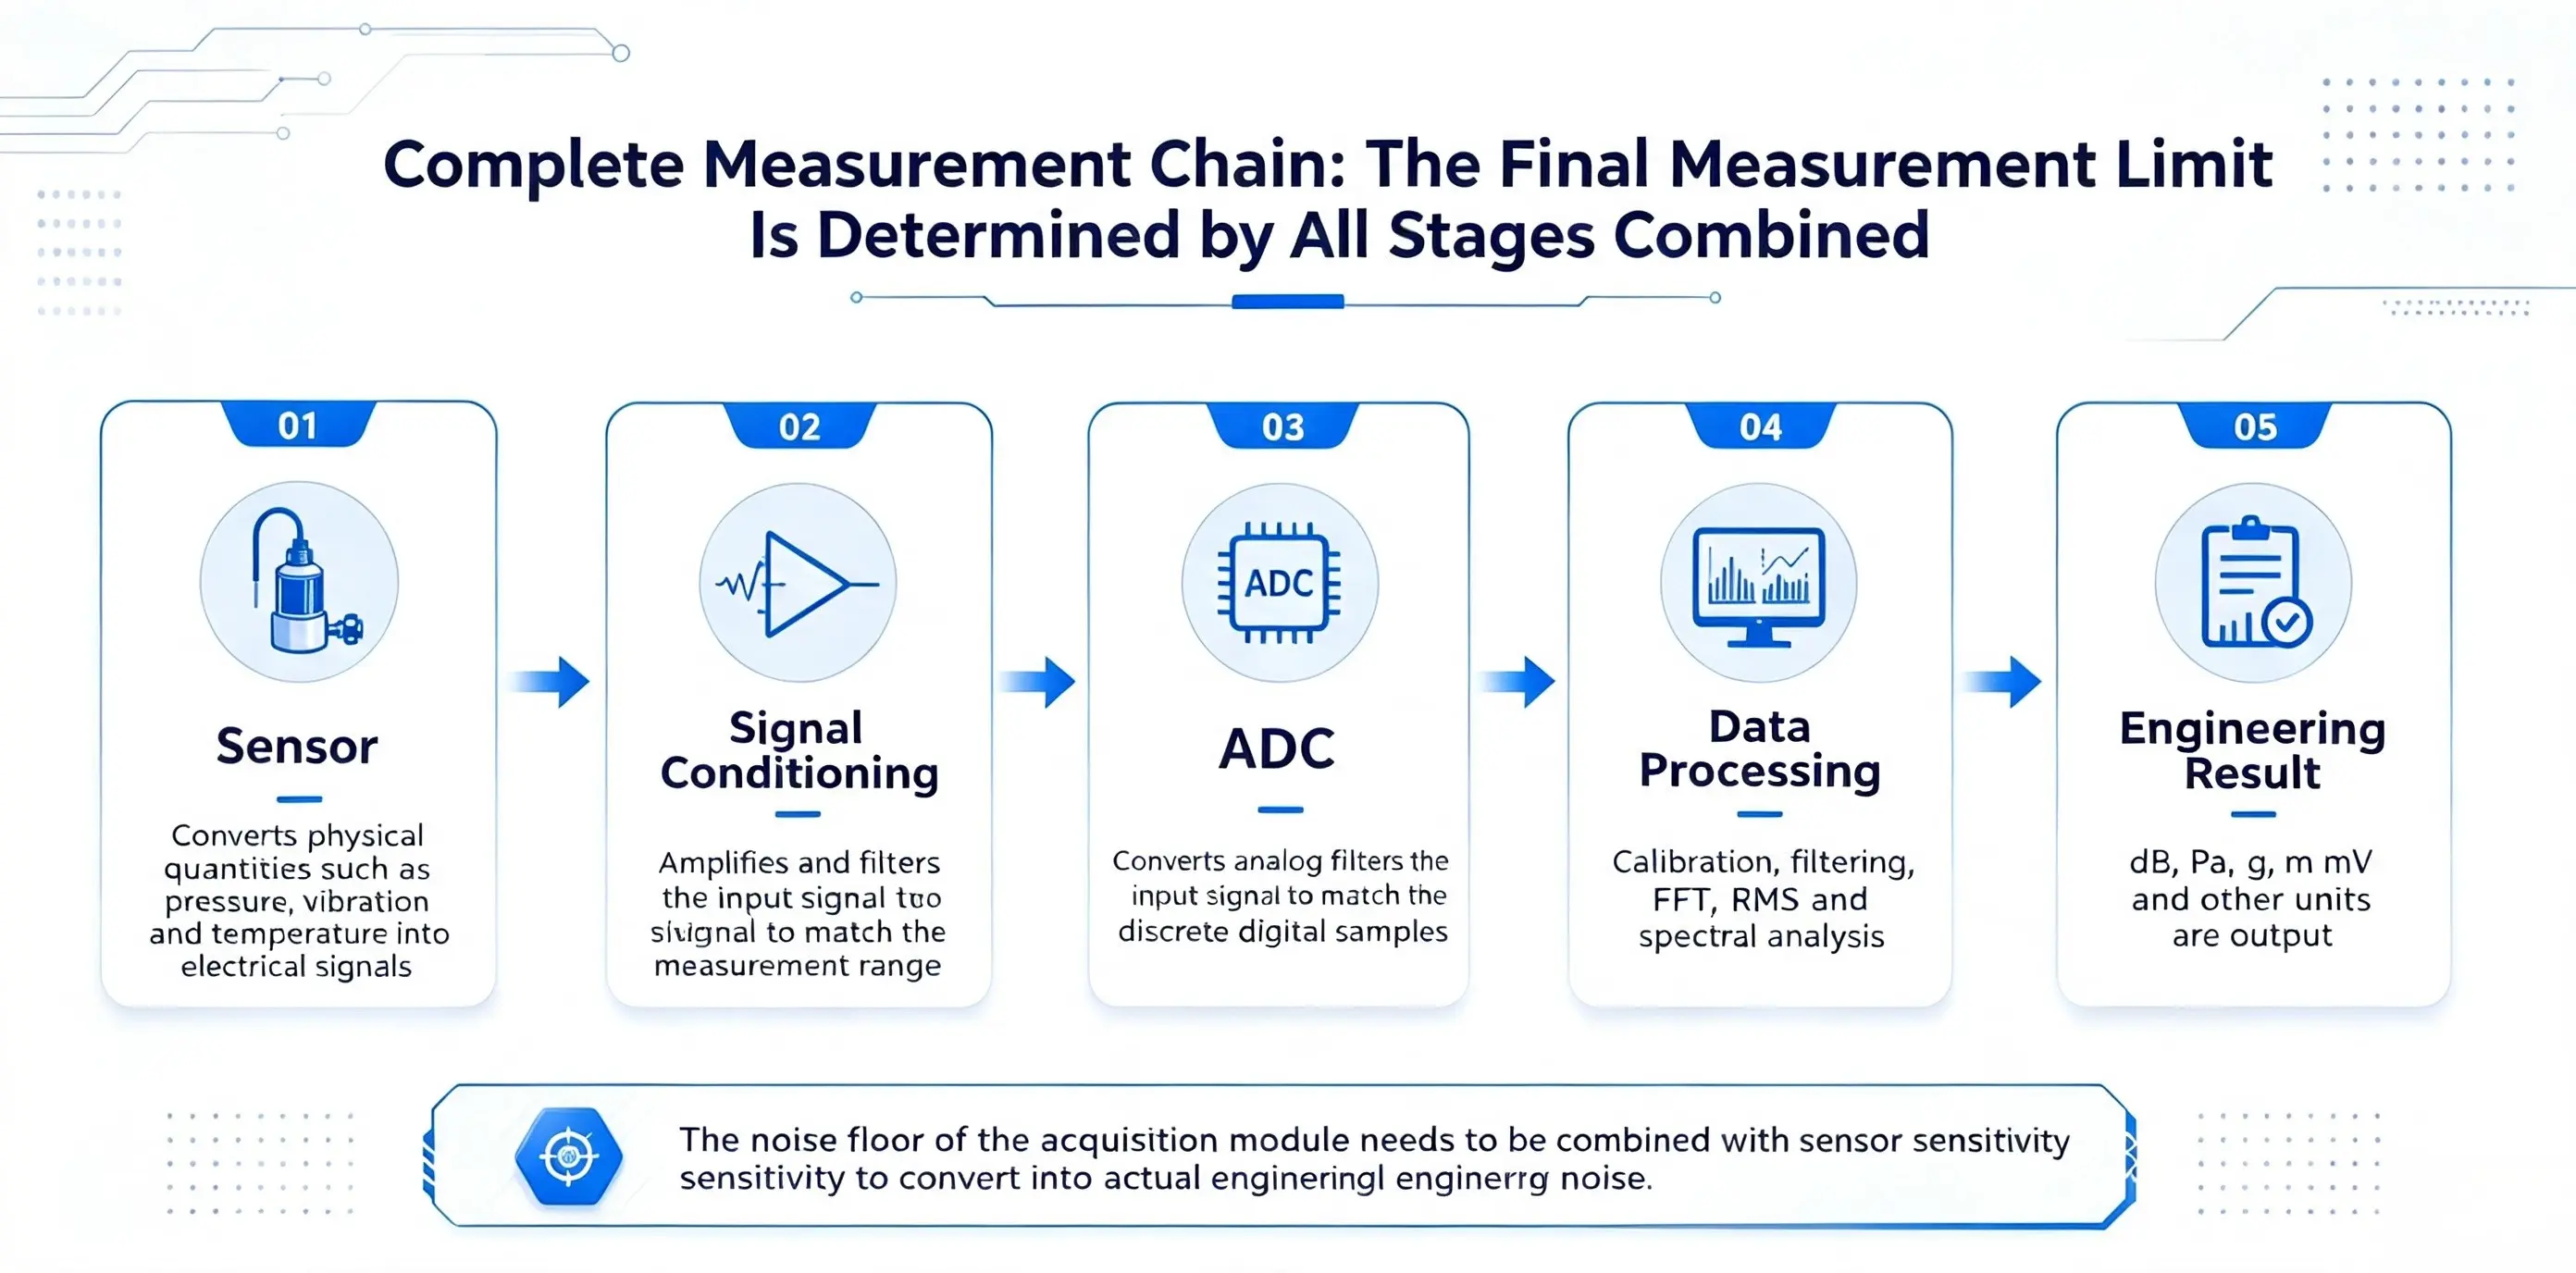
Figure 4_The Complete Measurement Chain Comprising Sensor, Signal Conditioning, ADC, and Software
Choosing the Right Input Range
The basic principle for selecting the input range is: choose the smallest range that can cover the signal, while ensuring the maximum transient peak does not overload and maintaining a reasonable margin.
- Estimate the Normal Signal Amplitude: Convert the physical quantity (sound pressure, acceleration, etc.) into input voltage based on the sensor's sensitivity.
- Consider Transient Peaks: In addition to the RMS value, consider the peak-to-average ratio, impact signals, start-stop processes, and abnormal operating conditions.
- Reserve Overload Margin: An initial setting where the maximum peak is 50% to 80% of the full-scale range can be used for stable, continuous signals. For impact or signals with significant amplitude variation, reserve a larger margin based on the peak-to-average ratio and safety requirements.
- Verify with a Pre-acquisition Test: Perform a pre-acquisition test, observing the time waveform, peak value, RMS, overload indicators, and spectral noise floor. If the signal's utilization of the range is too low, try reducing the range; if clipping or overload is indicated, increase the range.
How to Compare Data Acquisition System Specifications
When comparing different data acquisition systems, it is recommended to verify at least the following conditions:
- Under what input range, bandwidth, and filtering conditions was the dynamic range measured?
- Does the noise floor specification refer to dBFS, input-referred RMS noise, or noise spectral density?
- What are the integration bandwidth for the RMS noise and the resolution bandwidth for the FFT noise floor?
- Was A-weighting, filtering, or other post-processing used?
- Was the input shorted, terminated, or connected to an actual sensor?
- Are the noise floor and dynamic range provided for each range separately?
- Do the noise and distortion change after enabling IEPE or other sensor power supplies?
- Are reliable overload detection, range switching, and anti-aliasing filtering supported?
Also, note that the single-line noise floor displayed in an FFT plot is not equivalent to the integrated RMS noise floor over a specified bandwidth. The FFT size, sampling rate, window function, amplitude normalization, and resolution bandwidth all affect the displayed results; under otherwise identical conditions, a narrower resolution bandwidth typically results in a lower noise amplitude per bin. Therefore, one cannot judge a device's dynamic range or absolute noise performance based solely on a spectrum screenshot.
SonoDAQ Data Acquisition System
As a dynamic signal acquisition platform designed for acoustics, vibration, and general signal testing, SonoDAQ does not aim for an isolated 'high dynamic range' figure in its hardware design. Instead, it emphasizes optimizing the input equivalent noise distribution across the full range. For example, at a ±1 V range, its typical input equivalent noise can reach sub-microvolt levels, which is particularly important when capturing weak signals with high-sensitivity microphones or accelerometers.
Additionally, SonoDAQ offers multi-level hardware gain ranges from ±10 V to ±100 mV and independently calibrates the noise floor and THD+N performance for each range, rather than merely applying theoretical formulas. Coupled with the onboard hardware overload indicator and transient peak-hold functionality, users can select the input range according to basic guidelines, ensuring no overload while confidently matching the range to the optimal signal utilization zone.
Ultimately, the dynamic range specified in the datasheet is a 'ratio,' whereas SonoDAQ provides a 'verifiable measurement chain.' Whether you are monitoring subtle changes in sound pressure levels or capturing minute structural vibrations, its performance metrics are provided based on a unified testing standard and can be directly converted into corresponding engineering quantities, helping you avoid the 'digital trap' and focus your efforts on the testing itself.
Conclusion
Dynamic range, noise floor, and input range must be understood under a unified measurement context: the input range determines the measurement upper limit, the input-referred noise floor constrains the measurement lower limit, and the dynamic range describes the ratio span between them.
A large input range is suitable for strong signals or signals with unknown amplitude, but may not be ideal for weak signals. A small input range may lower the input-referred noise but reduces the overload margin. A high dynamic range indicates a large measurement span, but does not necessarily mean a lower absolute noise floor.
Therefore, when evaluating a data acquisition system, one should not only ask "What is the dynamic range?" but also confirm: For which input range, amplitude scale, measurement bandwidth, filtering, and input conditions is this specification valid? What is the input-referred noise for each range? When connected to an actual sensor, what is the corresponding measurement lower limit in engineering units?
Only by unifying the measurement context and completing the measurement chain conversion can the dynamic range in the specification sheet be translated into a reliable, reproducible, and practical engineering measurement capability.
To discuss an acoustic testing range or low-noise measurement setup for your application, complete the Get in touch form below. The CRYSOUND team can help you evaluate input range, noise-floor requirements, sensor compatibility, and system configuration.


