
When validating quietness for home appliances, fans, precision motors, medical devices, transformers, and consumer electronics, we are not only asking whether a product is "loud" or "quiet." We need to know where the sound comes from, under which operating condition it appears, and in which frequency range it becomes uncomfortable.
A quiet product can sometimes be like a person who does not express themselves clearly. It does not complain loudly; it simply produces a faint hum, whine, or buzz late at night. On a specification sheet, it may read only 18 dBA. Yet when a user gets close, they may still frown: the sound is not loud, but it is annoying.
That is the purpose of ultra-low-noise testing. It is not about asking the product to stand on a stage and announce how many decibels it has. It is about listening clearly to its very small movements, moods, and defects. A good test needs to answer four questions: Is the sound really generated by the product? Which frequency is it hiding in? When is it most obvious? After optimization, has it truly converged?
Microphones also "speak"
Many people assume that once a microphone is placed near a product, the product sound will simply enter the measurement system. In reality, a microphone is not an absolutely silent observer. It has its own self-noise, which is like the microphone's breathing: if that breathing is too heavy, very quiet product sounds can be covered up.
The inherent noise of common 1/2-inch measurement microphones is typically around 16 dBA. For ordinary noise testing, that is often sufficient. For high-end quiet products, however, 16 dBA may already be too noisy, because many of the subtle sounds that users care about may be near that level or even below it.
A 1-inch microphone can reduce inherent noise to about 10 dBA, which is much quieter. But it also has its own personality: with a larger diaphragm, frequency response and practical flexibility can be more limited, and high-frequency detail is not as friendly as with a broadband 1/2-inch solution. In other words, a 1/2-inch microphone has broader frequency capability but higher self-noise; a 1-inch microphone is quieter but less open in high-frequency detail.
This creates a dilemma in advanced quietness testing: at some frequencies, sounds that the human ear can perceive may already be below the microphone's own self-noise. Users can hear them, but the microphone says, "What I have here is mostly my own noise floor." That is why we need a rarer kind of ear: one that is both low-noise and broadband, so it can truly capture the subtle signals that matter to human perception.
| Role | Strengths | Limitations | Impact on testing |
| Common 1/2-inch microphone | Relatively flexible frequency response; suitable for general acoustic testing. | Inherent noise around 16 dBA. | When product sound is close to or slightly below 16 dBA, subtle abnormal noises may be masked by the microphone's own "breathing." |
| 1-inch low-noise microphone | Inherent noise can be reduced to about 10 dBA. | Frequency range and use conditions are more limited. | Can hear quieter sounds, but is less ideal for high-frequency whine, broadband detail, and flexible on-site setup. |
| Broadband low-noise 1/2-inch microphone | Designed to pursue both low inherent noise and wide frequency response. | Requires a more demanding front-end design. | Better suited for identifying high-frequency whine, faint electrical noise, and full-band abnormal sound in low-level products. |
Decibel value is total noise, not product character
dB is a logarithmic unit, not an ordinary ruler. A 3 dB increase in sound energy is approximately a doubling of energy, while a 10 dB increase is approximately ten times the energy. But the human ear does not listen to energy alone; it also picks out frequency. A very narrow frequency peak may not raise the overall dBA value very much, but it can still make people hear a clear "hum," "whine," or "buzz."
For example, two small fans may both measure 18 dBA. Sample A has a spectrum like a flat blanket, with no particularly prominent component. Sample B has a spike around 1.6 kHz that is more than 10 dB higher than the surrounding frequency bands. Their total decibel values look similar, but Sample B feels like someone suddenly clearing their throat in a quiet room; the ear notices it immediately. Mobile phones and headphones behave in the same way: bearings, resistive-capacitive components, displays, call paths, headphone amplifiers, and noise-cancelling modules can all reveal themselves through very quiet sounds.
| Acoustic symptom | Possible source | What to look for in data |
| Low-frequency hum | The issue may be related to structure, mounting, or electromagnetic vibration. | Check whether stable peaks appear at 50/60 Hz and harmonics, or in the 100-300 Hz range; observe whether peaks move when posture or fixture changes. |
| Rotating or bearing mechanical noise | Miniature bearings, hinges, motors, or fans inside a phone may be rubbing, jumping, or rotating unevenly. | Check whether rotational fundamental frequencies and harmonics appear steadily. For a 7-blade fan at 1,200 rpm, the blade-passing frequency is 1,200/60 × 7 = 140 Hz; 140 Hz and its harmonics deserve attention. |
| High-frequency noise from resistive-capacitive or power components | The source may be piezoelectric effects in ceramic capacitors, inductor whine, switching power supplies, or resistive-capacitive networks revealing faint high-frequency sound. | Check whether narrowband peaks appear from 2-20 kHz; switch among no-load, half-load, and full-load states, and see whether peaks change with load or power status. |
| Display noise | Screen brightness, refresh rate, PWM dimming, or display driver circuits may be "whispering." | Compare screen off, low brightness, high brightness, different refresh rates, and static/dynamic images; observe whether high-frequency peaks change synchronously. |
| Call-related noise | RF, power amplifier, receiver, or phone-body structure may introduce sound during call states. | Compare airplane mode, standby, dialing, in-call, weak-signal, and strong-signal conditions; check whether peaks or broadband noise appear from 100 Hz to 10 kHz and vary with call status. |
| Headphone noise | The headphone amplifier, Bluetooth module, ANC module, or driver may generate self-noise, electrical noise, or slight whine. | Compare muted playback, paused state, ANC on/off, transparency mode, and different volume settings; observe peaks from 1-10 kHz. |
Background noise and product sound are mixed together
During ultra-low-noise testing, background noise is highly disruptive. It will not tell you, "I am the air-conditioning noise in the room," or "I am the noise floor of the test system." It simply mixes into the result and makes the product appear louder than it really is.
Sound also cannot be subtracted like ordinary numbers. For example, if the true product sound is 12 dBA and the room background is already 10 dBA, the instrument sees the energy sum of the two.
Total noise: L_total = 10 log10(10^(L_product/10) + 10^(L_background/10))
Example: 10 log10(10^(12/10) + 10^(10/10)) = 10 log10(15.85 + 10) = 14.12 dBA
In this example, the background is only 2 dB lower than the product, and the total reading is raised by 14.12 − 12 = 2.12 dB.
Estimated product level: L_product = 10 log10(10^(L_total/10) − 10^(L_background/10))
In simple terms, the closer the background level is to the product level, the less reliable the test conclusion becomes.
| How much lower the background is than the product | How much the total reading is raised | What it means |
| 3 dB | About 1.8 dB | The background is already competing for attention; the result is not very stable. |
| 6 dB | About 1.0 dB | Barely usable, but the background influence must be stated in the report. |
| 10 dB | About 0.4 dB | Relatively reliable and suitable for before/after optimization comparison. |
| 15 dB | About 0.1 dB | Background influence is minimal; suitable for ultra-low-noise validation. |
Recommended fixed conditions and analysis metrics
When product sound is very quiet, even a small movement can change the result. Moving the microphone 5 cm closer, letting a cable touch the tabletop, changing the fixture position, or slightly changing the product orientation can all alter the spectrum. To make before/after data comparable, the product must "speak" in the same posture and under the same state every time.
| Fixed condition | Recommended metric or record | What happens if it is not fixed |
| Position | Distance, angle, and orientation, such as 30 cm in front of the product or 1 m on-axis. | When distance or direction changes, sound pressure level and spectrum change accordingly. |
| Operating state | Voltage, speed, gear, load, temperature, and running time. | Many abnormal sounds appear only at a specific speed point or load point. |
| Analyzer settings | Sampling rate, test duration, channel, and A-weighting or Z-weighting. | Without original settings, later recalculation and reproduction are difficult. |
| Repeatability | Repeat the same condition at least three times; record the average and the maximum difference. | If the three measurements differ greatly, check the test conditions before changing the product. |
| Noise floor | Environmental background and complete system noise floor. | This determines whether product sound is truly higher than the environment and the test equipment. |
Roles of the CRYSOUND low-noise testing solution
If an ultra-low-noise test is treated as a careful act of listening, the acoustic shielded chamber or test box is the quiet room, the microphone is the ear, the IED module is the high-resolution memory, SonoDAQ Pro is the long-term recorder, and OpenTest is the person who translates sound into spectra and reports. The environment must be quiet and repeatable; the ear must be low-noise and broadband; the memory must be fast and have wide dynamic range; the recorder must support synchronization and expansion; and the software must connect spectra, octave bands, sound levels, and reports into one workflow.
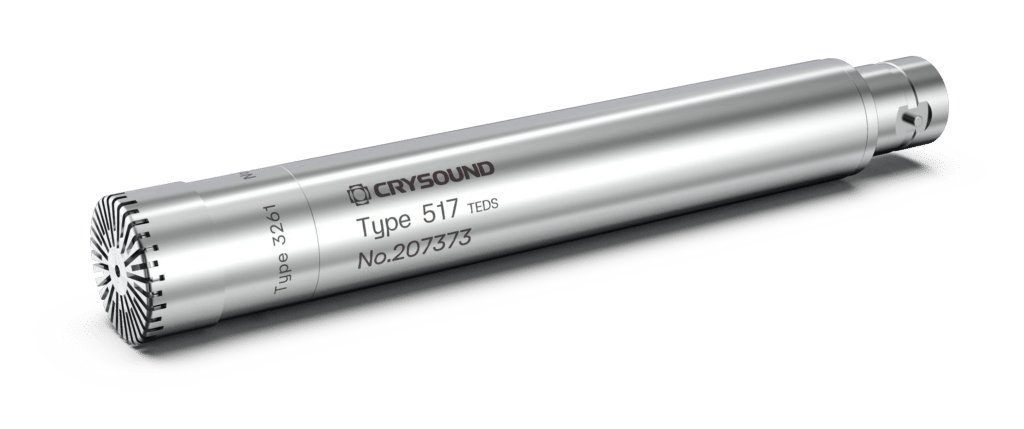
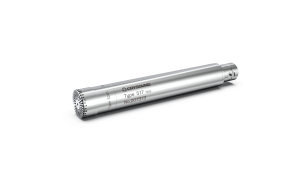
CRY3261-S02: a quiet ear
The CRY3261-S02 consists of a CRY3261 measurement microphone and a CRY517 IEPE preamplifier. The key official parameters include: 1/2-inch free-field prepolarized microphone, 450 mV/Pa sensitivity, 6 Hz-20 kHz frequency range, and 6.5 dBA inherent noise. Its task is straightforward: keep itself quiet first, listen broadly enough across frequency, and then capture the lighter and finer sounds generated by the product.
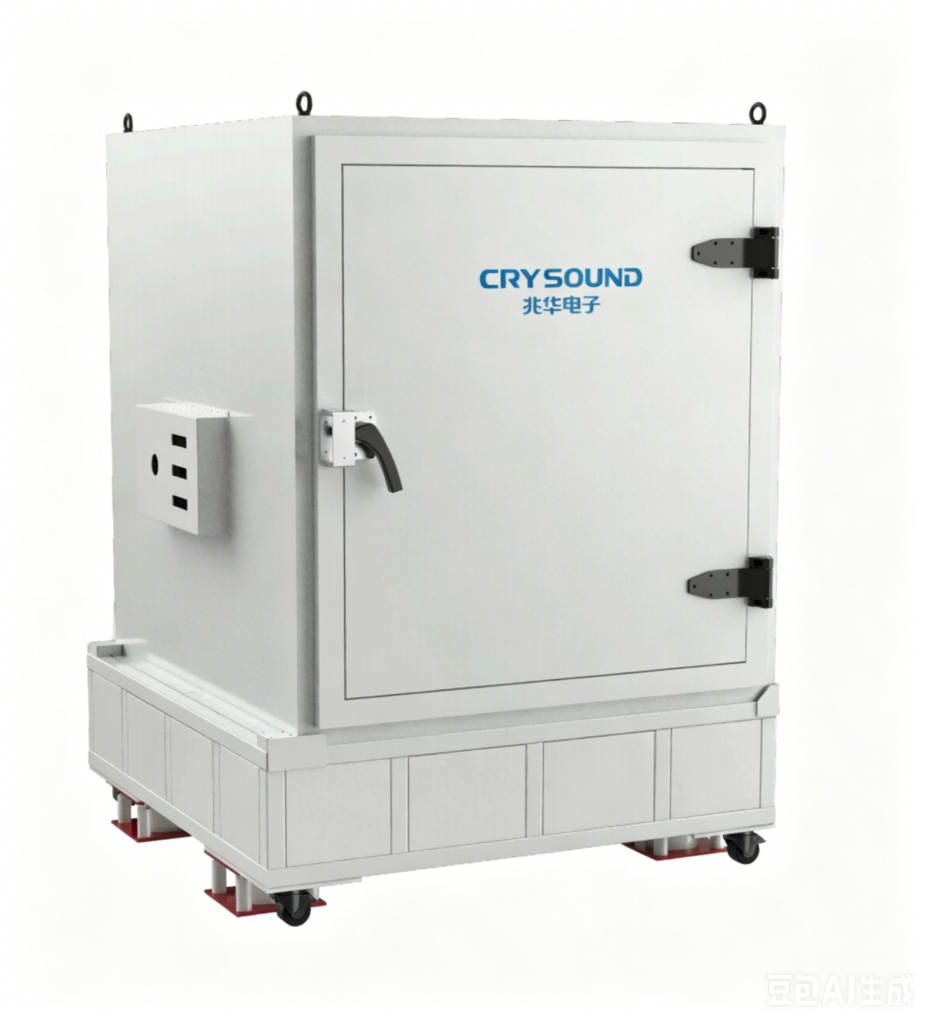
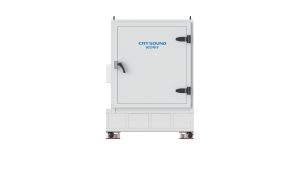
CRY7412 acoustic shielded chamber: a quiet room that pushes the background away
The CRY7412 acoustic shielded chamber provides a low-noise, interference-controlled environment with a noise floor as low as 6.5 dBA for acoustic measurement, improving repeatability in laboratories and production lines. For small consumer electronics such as mobile phones, headphones, displays, and resistive-capacitive components, it is like arranging a quiet room for the product: external environmental sound, vibration, and RF interference are pushed into the background first, so the microphone can more easily hear the product's own self-noise, whine, or electrical noise.
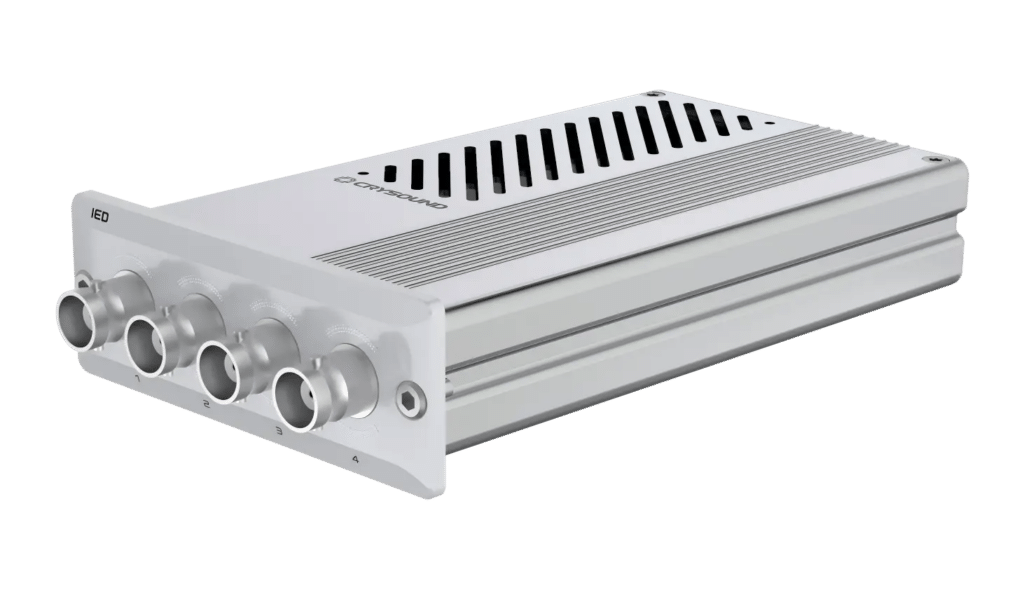
CRY5011 IED high-precision input module: preserving faint details
The CRY5011 IED is a 4-channel IEPE/Voltage input module. It provides a sampling rate up to 204.8 kHz, 32-bit resolution, dynamic range up to 160 dB, THD+N ≤ −102 dB, a noise floor as low as ≤ −117 dBV, and TEDS support. For faint signals such as headphone noise, display noise, or high-frequency sound from resistive-capacitive components, these parameters mean that quiet sounds are less likely to be lost and transients are less likely to be blurred.
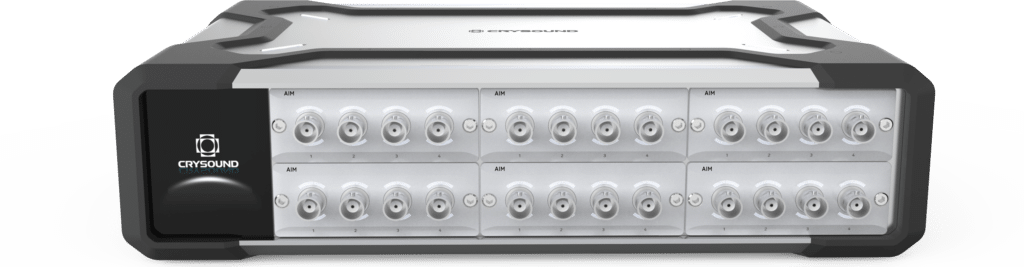
CRY5820 SonoDAQ Pro: a high-performance base that synchronizes and expands
The CRY5820 SonoDAQ Pro is a modular data acquisition system. A single chassis supports up to 24 channels with six modules, and expanded systems can support distributed multi-channel testing. It supports 1000 V channel isolation, inter-chassis synchronization skew of less than ±100 ns, USB-C, Gigabit LAN, CAN FD, Wi-Fi, and local microSD storage.
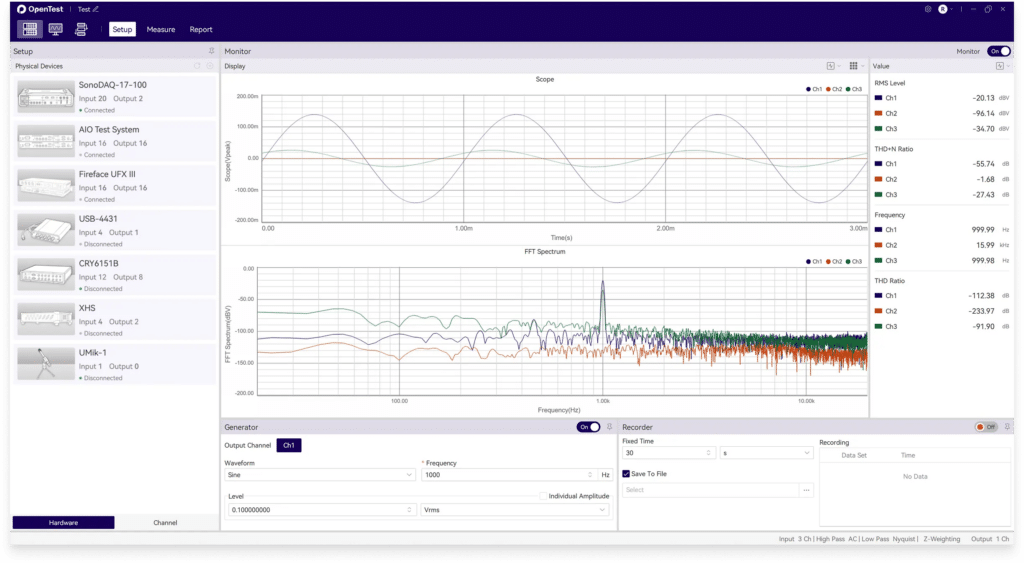
OpenTest: translating sound into spectra and reports
OpenTest is CRYSOUND's acoustic and vibration testing platform. It supports hardware connection methods such as OpenDAQ, ASIO, WASAPI, and Core Audio, as well as FFT, octave-band analysis, sound level meter functions, sound quality analysis, playback comparison, waveform/data export, and report generation. The subtle sounds captured by the microphone and recorded by the acquisition system are ultimately transformed in OpenTest into spectra, sound levels, trends, and traceable reports.
| Device | Key official data | Meaning in ultra-low-noise testing |
| CRY3261-S02 | 1/2 inch; 450 mV/Pa; 6 Hz-20 kHz; inherent noise 6.5 dBA; dynamic range 6.5 dBA-100 dB. | Makes the "ear" both quiet and broadband, suitable for product self-noise near or below 10 dB, headphone self-noise, and high-frequency detail testing. |
| CRY5011 IED module | 4 channels; IEPE/Voltage; 204.8 kHz; 32-bit; dynamic range up to 160 dB; THD+N ≤ −102 dB; noise floor ≤ −117 dBV; TEDS. | The low front-end noise and wide dynamic range help preserve weak acoustic signals and support left/right headphone tests, multi-microphone comparisons, and synchronized acoustic-vibration analysis. |
| CRY5820 SonoDAQ Pro | Up to 24 channels per chassis; 1000+ channels with expansion; 1000 V channel isolation; inter-chassis synchronization skew < ±100 ns; USB-C/Gigabit LAN/CAN FD/Wi-Fi; local microSD storage. | Synchronizable and expandable, suitable for moving from a single headphone sample to multi-channel, multi-condition applications. |
| CRY7412 acoustic shielded chamber | Provides a low-noise, interference-controlled environment with a noise floor as low as 6.5 dBA; supports RF shielding and Bluetooth/Wi-Fi wireless testing. | Lets the "quiet room" reduce environmental noise and interference first, providing a reliable and repeatable background so external noise is not mistaken for product noise. |
| OpenTest | Supports OpenDAQ / ASIO / WASAPI / Core Audio; FFT, octave bands, sound level meter, sound quality; Lp/Lmax/Lmin/Leq/Lpeak/Ln/LE; waveform/data export and report generation. | Turns weak sounds into spectra, octave-band results, sound-level trends, and traceable reports for easier communication among R&D, quality, and customers. |
To learn more about microphones, preamplifiers, and related testing solutions, please visit the CRYSOUND website for additional product information and contact the team for further discussion.If necessary, please fill out the Get in touch form below.
OpenTest
CRY3261-S02 Ultra-Low-Noise Free-Field Microphone Set, 1/2", 450mV/Pa
CRY7412 Ultra-Quiet Chamber
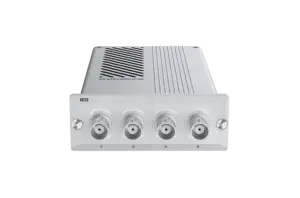
CRY5011 IEPE Analog In - IED
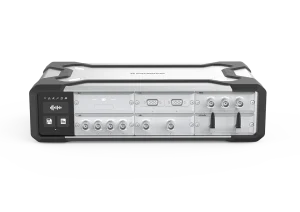
CRY5820 SonoDAQ Pro
OpenTest
CRY3261-S02 Ultra-Low-Noise Free-Field Microphone Set, 1/2", 450mV/Pa
CRY7412 Ultra-Quiet Chamber
CRY5011 IEPE Analog In - IED


