
Wind tunnels were originally built to see the flow. Within a controlled test section, engineers direct airflow at a specified velocity over vehicles, wings, UAVs, rotor blades, or scale models. By analyzing pressure distributions, aerodynamic forces and moments, smoke visualization, Particle Image Velocimetry (PIV), and balance measurements, they can determine whether flow separation occurs, drag is reduced, or lift remains stable.
Today, however, wind tunnels are taking on an increasingly important new role: listening to sound. For many products, competitiveness is no longer determined solely by aerodynamic performance or efficiency. It is also defined by how quiet the product is.
In electric vehicles, the reduction of powertrain noise makes aerodynamic wind noise far more noticeable to passengers during high-speed cruising. UAVs and eVTOL aircraft must reduce rotor noise to enable broader urban and low-altitude applications. Wind turbine blades, ventilation systems, and aerospace components are all facing increasing demands from noise regulations, user comfort expectations, and structural optimization requirements.
As a result, a new question has emerged in wind tunnel testing:
Where exactly does the noise come from?
Why Wind Tunnels Need Large Acoustic Arrays
A single microphone can measure sound pressure levels, but it cannot easily answer the question of where the noise source is located.
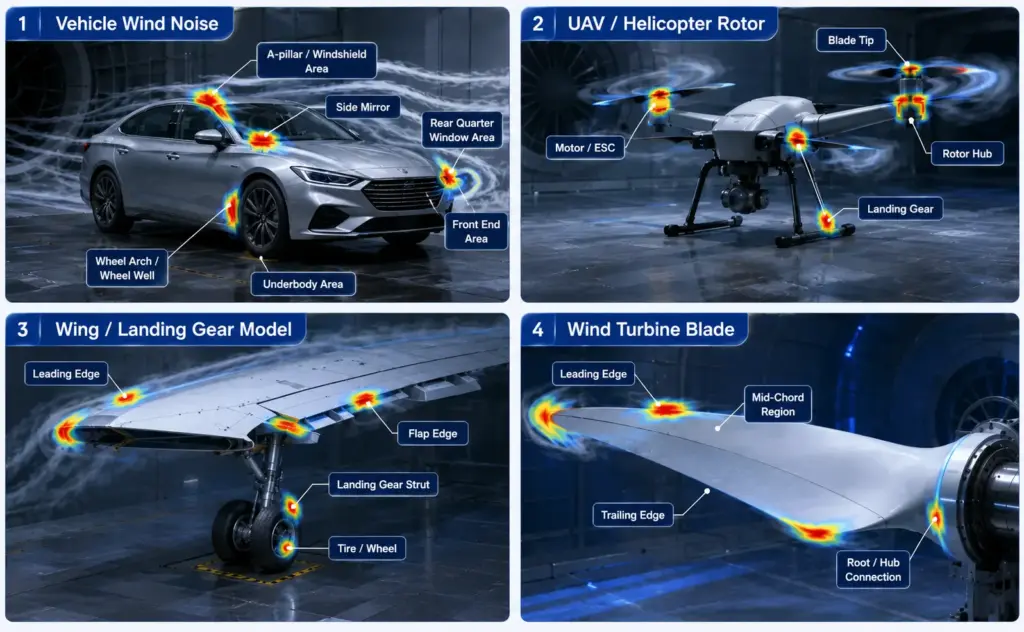
In wind tunnel testing, noise often originates from multiple structural locations. For vehicles, sources may include the A-pillar, side mirrors, wheel arches, or underbody regions. For UAVs and aerospace components, noise may originate from rotor tips, wing edges, blade trailing edges, or ventilation outlets.
If engineers can only observe the overall sound pressure level, it becomes difficult to identify which structure is responsible for the noise or determine whether a design modification has been effective.
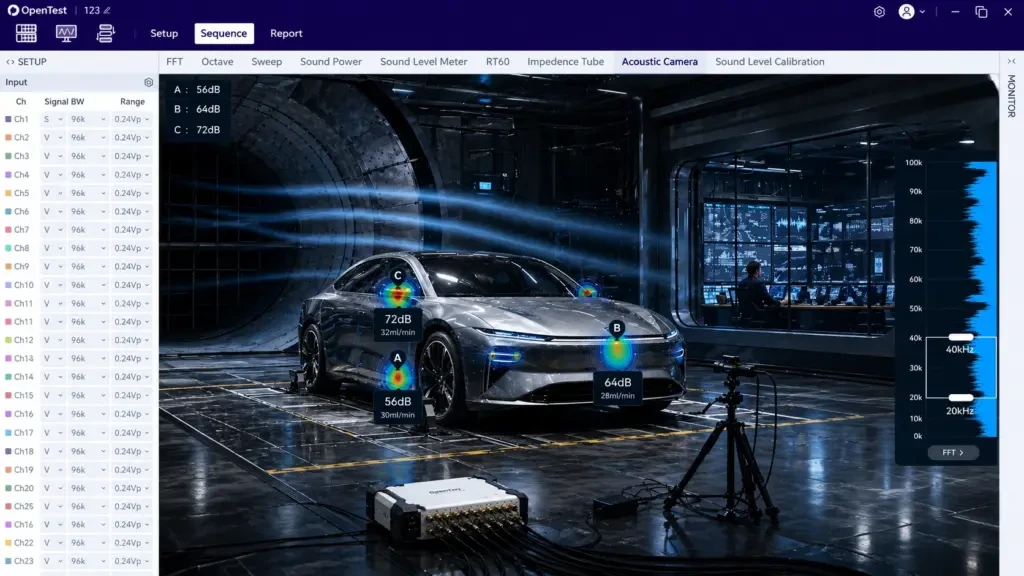
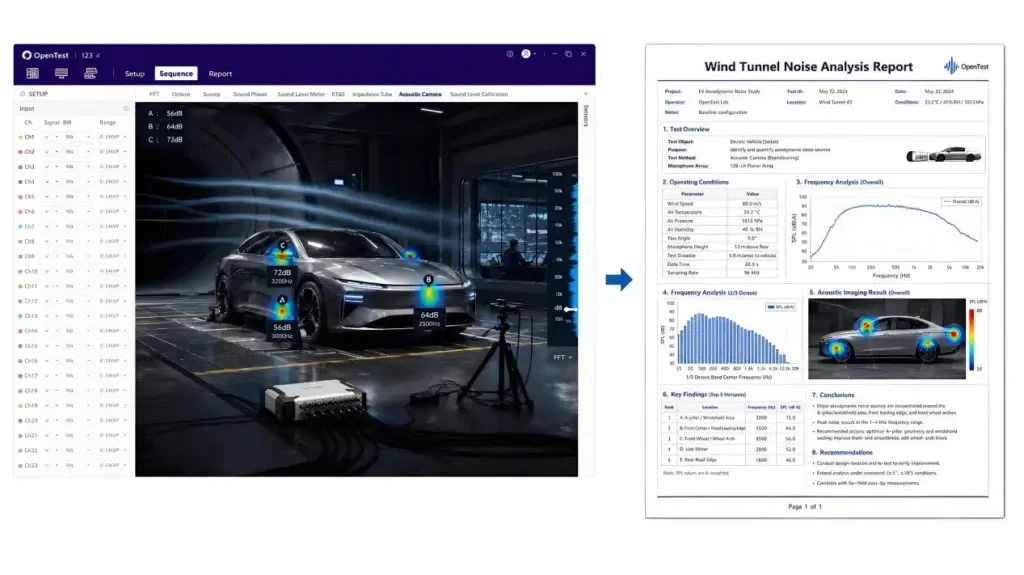
The value of large-array acoustic imaging lies in its ability to synchronously capture sound field information using a multi-channel microphone array and combine it with source localization algorithms. This transforms invisible noise sources into intuitive acoustic heat maps.
As a result, wind tunnel testing moves beyond simply measuring sound. It becomes a tool for generating engineering insights that are interpretable, comparable, and deliverable.
How Large Acoustic Arrays "See" Sound
Sound is invisible, but it does not arrive at every microphone at exactly the same time.
Imagine a noise source located somewhere on a test model. As the acoustic wave propagates outward, the distance to each microphone within the array differs slightly. Consequently, the arrival time at each microphone also differs.
Acoustic imaging utilizes these tiny time delays and phase differences to construct a scanning grid across a model surface or a three-dimensional region of interest.
For each scanning point, the software calculates:
If the sound originated from this location, how should the signals from all microphones be delayed and aligned?
When the assumed location is close to the true source position, signals from multiple microphones become phase-aligned and reinforce one another, resulting in increased acoustic energy. Signals originating from other locations remain misaligned and are therefore suppressed.
By repeating this process across the entire scan area, the system generates a spatial distribution of acoustic source strength, commonly visualized as an acoustic heat map or noise map.
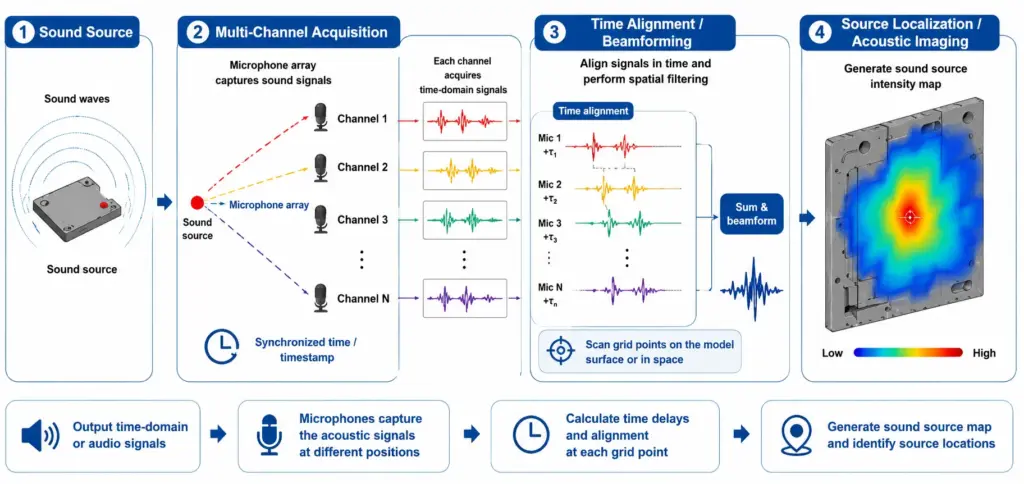
This is perhaps the most intuitive value of acoustic imaging: transforming invisible sound into visual information that engineers can analyze, compare, and use for decision-making.
Why Acoustic Measurements Are More Challenging in Wind Tunnels
Even in a quiet room, accurate source localization requires a stable acoustic environment and precise phase information. Inside a wind tunnel, however, the challenges become significantly greater.
Stronger Background Noise
A wind tunnel is far from a quiet measurement environment.
Fans, nozzles, support structures, boundary layers, and reflective surfaces all generate acoustic interference. In addition, microphones exposed to high-speed airflow experience flow-induced self-noise caused by interactions between the air stream and the microphone body.
More Complex Noise Sources
Wind tunnel noise rarely originates from a single source.
In vehicle testing, side mirrors, A-pillars, wheel arches, and underbody structures may all contribute simultaneously. In rotorcraft testing, rotor tips, blade trailing edges, electric motors, and structural components may generate noise across different frequency bands.
Engineers therefore require more than a simple indication of source location. They need to understand how noise sources are distributed across frequencies and how they evolve under different operating conditions.
Higher Synchronization Requirements
Acoustic arrays typically involve dozens or even hundreds of microphones sampling simultaneously.
Even a small timing mismatch between channels can distort phase relationships, leading to localization errors, blurred source maps, or incorrect conclusions.
For acoustic imaging systems, precise synchronization is not an optional feature-it is the foundation of measurement reliability.
Engineering-Ready Results
The value of wind tunnel testing extends beyond collecting raw waveform data.
Customers ultimately require results that support engineering decisions, including:
- Frequency spectra
- Acoustic source maps
- Operating-condition comparisons
- Design modification validation
- Standardized test reports
In other words, a successful system must not only capture data accurately, but also make the results understandable, comparable, and actionable.
The challenge of wind tunnel aeroacoustics is therefore not simply a matter of higher noise levels. It involves simultaneously addressing complex environments, multiple noise sources, high-precision synchronization, and engineering-oriented result delivery.
The SonoDAQ Large-Array Solution: A Complete Platform from Acquisition to Imaging
The SonoDAQ large-array aeroacoustic imaging solution is specifically designed for these demanding wind tunnel applications.
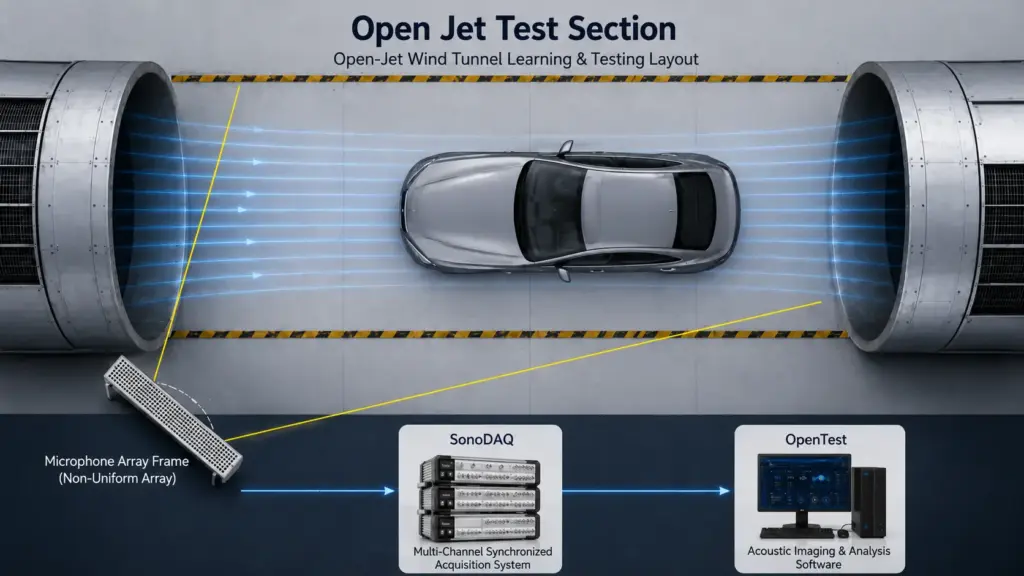
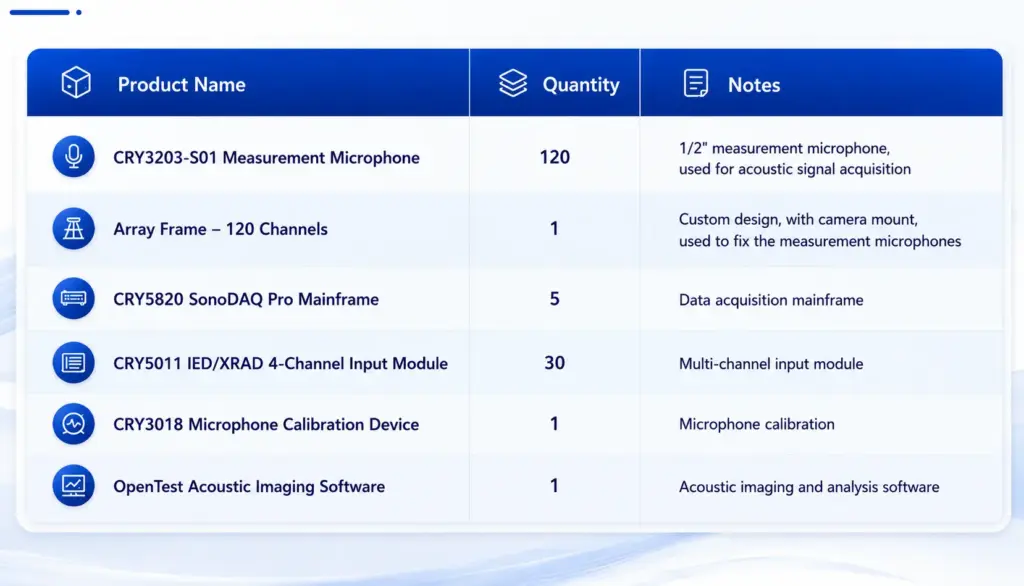
The platform consists of three key components:
- A microphone array
- The SonoDAQ multi-channel synchronized acquisition system
- OpenTest acoustic imaging and analysis software
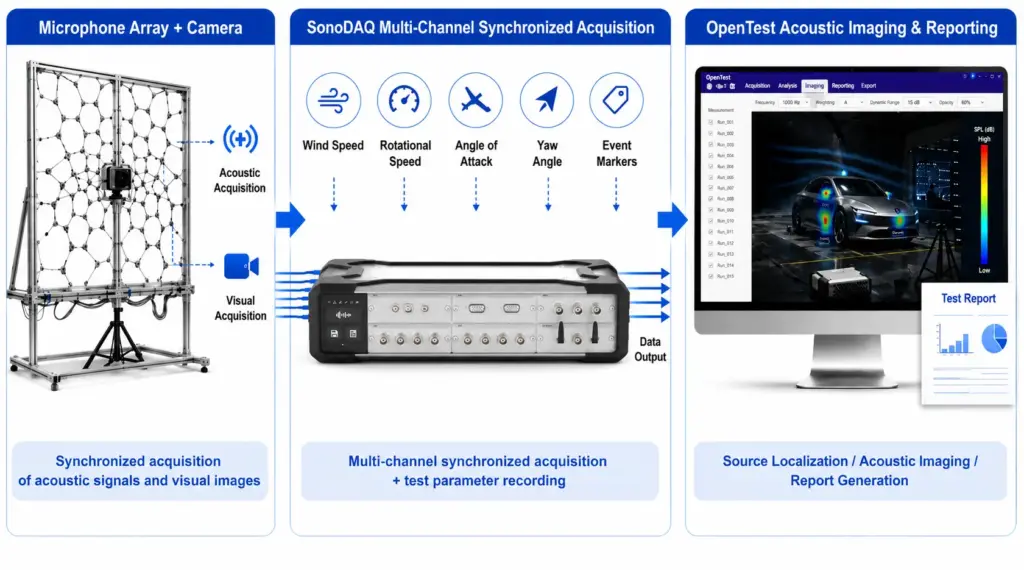
The microphone array captures acoustic field information outside the test section while synchronized cameras provide visual references of the test object.
SonoDAQ performs multi-channel synchronized sampling, signal conditioning, and data acquisition. The system can also integrate additional test parameters such as wind speed, rotational speed, angle of attack, yaw angle, and operating-condition markers.
OpenTest provides:
- SPL analysis
- FFT analysis
- 1/3-octave analysis
- Acoustic source localization
- Heat map visualization
- Report generation
The goal is not simply to record more audio channels. It is to help wind tunnel facilities establish a complete aeroacoustic testing capability-one that delivers accurate measurements, clear visualization, meaningful comparisons, and professional reporting.
Advantages of Non-Uniform Arrays
In acoustic imaging, simply increasing the number of microphones or arranging them in a highly regular pattern does not necessarily produce better results.
The geometry of a microphone array directly influences spatial resolution, usable frequency range, sidelobe levels, and the ability to suppress false sources. In other words, two arrays with the same 120-channel count may produce dramatically different source maps depending on their layout.
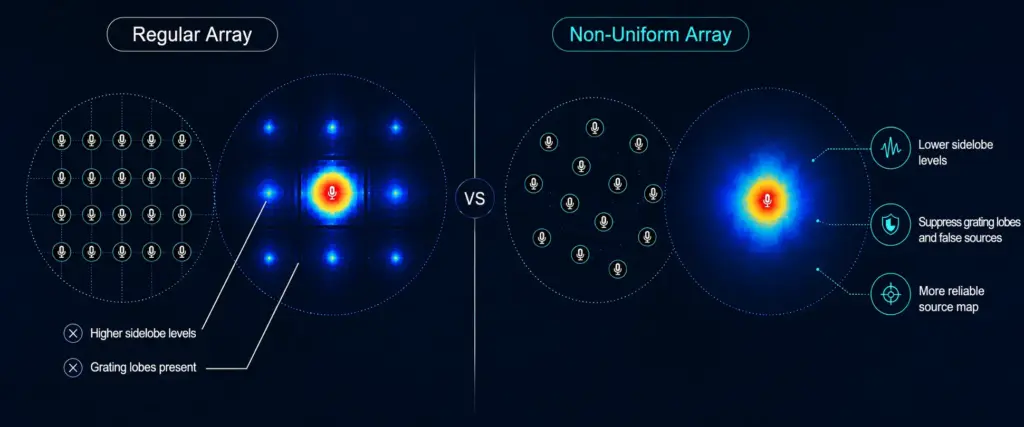
Uniform arrays offer advantages such as simple construction, calibration, and manufacturing. However, they also introduce an inherent challenge: periodic spatial distribution.
When acoustic waves are received and processed for beamforming, this periodicity can generate grating lobes and sidelobes, resulting in artificial hotspots that do not correspond to real noise sources.
For simple single-source scenarios, these artifacts may be manageable. In wind tunnel testing, however, vehicles, rotor systems, aircraft wings, and wind turbine blades are often large, geometrically complex, and capable of generating noise across multiple frequency bands simultaneously. Under such conditions, strong false sources can significantly interfere with source identification.
The fundamental principle of a non-uniform array is to intentionally break this spatial periodicity.
By distributing microphones according to optimized non-regular geometries, the array can:
- Reduce sidelobe levels
- Suppress grating lobes
- Improve false-source rejection
- Enhance multi-source separation capability
For large-scale models and broadband aeroacoustic analysis, this results in cleaner acoustic maps that more accurately represent true source distributions.
The SonoDAQ large-array solution can be customized according to:
- Test object dimensions
- Wind tunnel geometry
- Target frequency range
- Measurement distance
Whether the application involves vehicle wind noise, UAV rotor noise, aircraft components, or wind turbine blades, the array geometry can be optimized around the specific testing objective.
The purpose of a non-uniform array is not to create a more complex-looking array. Its purpose is to deliver source localization results that are more reliable, interpretable, and useful for engineering decisions.
100 ns Synchronization: The Foundation of Large-Channel Acoustic Imaging
Acoustic source localization depends on extremely small differences in sound arrival time.
As sound propagates from a source to different microphones within an array, slight differences in propagation distance result in slight differences in arrival time. Acoustic imaging algorithms use these time delays and phase relationships to reconstruct source locations.
As array sizes grow to 120 channels and beyond, all devices, modules, and channels must share a common and highly stable time reference.
SonoDAQ Pro supports PTP (Precision Time Protocol, IEEE 1588v2) synchronization, enabling multiple acquisition units to operate under a unified clock system.
Through PTP synchronization, the system achieves:
- Device-to-device synchronization accuracy < 100 ns
- Intra-device synchronization accuracy < 30 ns
This provides a reliable timing foundation for large-scale acoustic imaging applications.
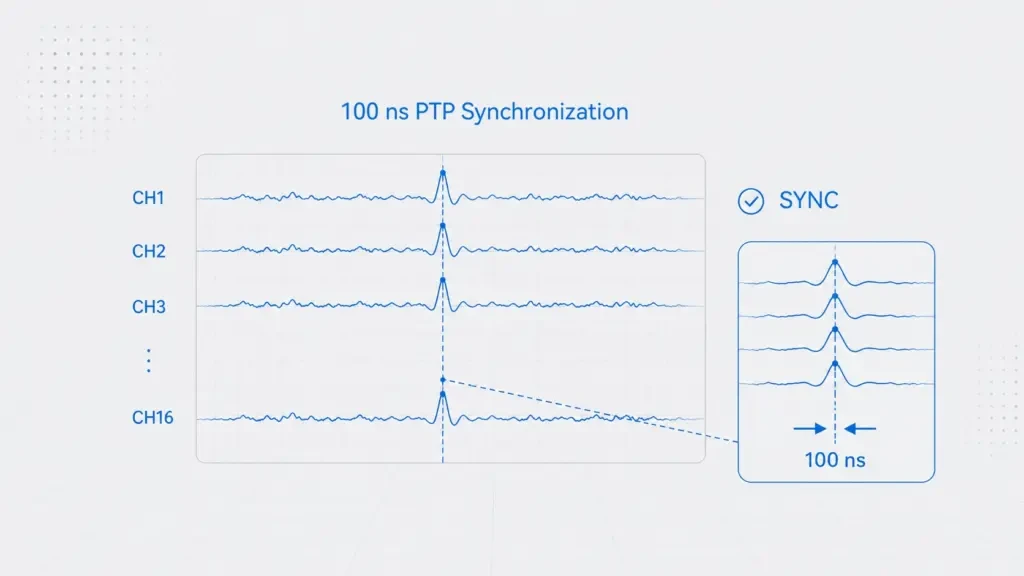
Synchronization is particularly critical in wind tunnel testing.
Within a large acoustic array, even small timing deviations between channels can distort phase relationships and ultimately reduce source localization accuracy.
PTP synchronization enables multiple SonoDAQ Pro units to operate as a single coherent acquisition system, ensuring consistency across large channel counts while providing trustworthy data for:
- Spectral analysis
- Source localization
- Operating-condition comparison
- Automated reporting
At the same time, SonoDAQ features a modular architecture that allows systems to scale from:
- 24 channels
- 48 channels
- 120 channels
- 256+ channels
- Larger custom configurations
For wind tunnel facilities, this means the system can support both initial proof-of-concept demonstrations and long-term development of comprehensive aeroacoustic testing capabilities.
From Acoustic Maps to Design Validation
Perhaps the most compelling aspect of acoustic imaging is the acoustic heat map itself.
By overlaying acoustic source intensity onto an image of the test object, engineers can immediately identify areas where noise is concentrated.
However, in wind tunnel testing, acoustic maps are valuable not because they look impressive, but because they help engineers determine root causes, compare design alternatives, and validate modifications.
For engineering analysis, a heat map is usually only the starting point.
Engineers still need to answer questions such as:
- Which frequency bands dominate the hotspot?
- Does the source persist at different wind speeds?
- How does source location change with angle of attack or yaw angle?
- Has a design modification reduced, shifted, or introduced new noise sources?
Only when acoustic maps are combined with frequency spectra, sound pressure levels, operating parameters, and structural information do they become truly meaningful engineering tools.
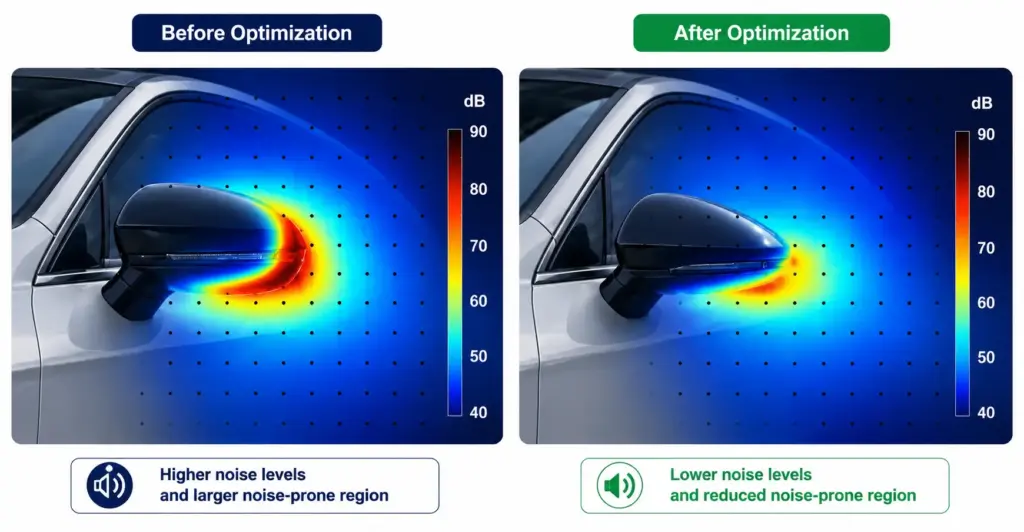
For example, during side-mirror wind-noise optimization, engineers can compare acoustic maps before and after a design modification.
Prior to optimization, a strong acoustic hotspot may appear near the rear and lower regions of the side mirror, indicating significant flow separation and local turbulence. After optimization, the high-pressure acoustic region becomes noticeably smaller and the overall acoustic intensity decreases.
This provides direct evidence that the aerodynamic redesign has successfully reduced wind noise.
Such comparison capabilities are particularly valuable during design validation.
Using the same array, acquisition system, and analysis workflow, engineers can evaluate:
- Overall SPL reduction
- Improvement within target frequency bands
- Reduction of existing hotspots
- Emergence of new noise sources
Compared with relying solely on single-point measurements or individual spectra, acoustic maps combined with spectral and operating-condition data provide a far more intuitive and defensible assessment of design performance.
The value of the SonoDAQ + OpenTest platform lies in connecting:
- Multi-channel acoustic measurements
- Synchronized timestamps
- Wind speed
- Rotational speed
- Angle of attack
- Yaw angle
- Operating-condition markers
- Spectral data
- Acoustic heat maps
- Report templates
into a unified workflow that spans acquisition, analysis, localization, comparison, and reporting.
For wind tunnel operators, this not only improves testing efficiency but also helps establish repeatable methodologies and standardized reporting processes.
Recommended Wind Tunnel Layout
For aeroacoustic testing, the Open Jet Test Section is one of the most suitable wind tunnel configurations for acoustic imaging and source localization.
In this arrangement, airflow exits the nozzle into an open test region, where the model is positioned within the free jet while acoustic measurement equipment remains outside the jet boundary.
For microphone arrays, the open-jet configuration offers considerable flexibility.
Arrays may be installed:
- Beside the model
- Above the model
- At oblique forward viewing angles
allowing better observation of surface noise, wake-related noise, and localized aerodynamic sources.
At the same time, the array is typically positioned outside the free-jet boundary to minimize flow-induced microphone noise.
The key advantages of open-jet configurations include:
- Greater flexibility in array placement
- Larger achievable array apertures
- Improved viewing geometry
- Reduced wall reflections
- Reduced acoustic distortion caused by closed test-section boundaries
As a result, open-jet wind tunnels generally provide more reliable acoustic imaging and source localization performance.
For applications involving aeroacoustic source identification, localization, and beamforming analysis, open-jet test sections are often the preferred choice.
Typical Application Scenarios
Aeroacoustic noise is not limited to a specific type of product. Whenever a structure interacts with moving air, phenomena such as flow separation, vortex shedding, boundary-layer disturbances, leakage through gaps, or rotating components can generate audible noise.
For engineering teams, the real challenge is often not detecting noise, but linking that noise to specific structures, frequency bands, and operating conditions.
The SonoDAQ large-array acoustic imaging solution establishes a spatial "noise map" within the wind tunnel environment, enabling engineers to move beyond overall sound pressure measurements toward:
- Structural-level source localization
- Frequency-specific analysis
- Design modification validation
Electric Vehicles and Automotive Wind Tunnel Testing
In electric vehicle and full-vehicle wind tunnel testing, the SonoDAQ large-array system can identify wind-noise sources associated with:
- A-pillars
- Side mirrors
- Wheel arches
- Underbody structures
- Door gaps and sealing interfaces
This helps engineering teams evaluate aerodynamic refinements and sealing improvements during vehicle development.
UAV and eVTOL Development
For UAVs and eVTOL aircraft, the system can localize noise generated by:
- Rotor blades
- Blade tips
- Rotor arms
- Airframe edges
- Structural interfaces
The resulting data supports low-noise vehicle architecture development and certification efforts.
Aerospace Component Testing
In aerospace applications, large-array acoustic imaging can be used to identify aeroacoustic sources associated with:
- Wings
- Slats
- Flaps
- Landing gear
- Control surfaces
This enables engineers to evaluate and validate low-noise aerodynamic designs.
Wind Turbines and Ventilation Equipment
For wind turbine blades and industrial ventilation systems, the solution can identify major noise contributors such as:
- Blade trailing edges
- Air outlets
- Support structures
- Local flow-disturbance regions
This information supports noise reduction design and operating-condition optimization.
Building a Deliverable Aeroacoustic Testing Capability
Ultimately, wind tunnel operators are not simply looking to acquire a system capable of recording sound.
Their goal is to establish a complete aeroacoustic testing capability that can support commercial testing projects and deliver engineering value to customers.
Such a capability includes:
- Reliable multi-channel acoustic acquisition
- Accurate synchronization with wind tunnel operating parameters
- Noise-source localization
- Spectral analysis
- Acoustic heat-map generation
- Design modification validation
- Standardized reporting
The SonoDAQ large-array aeroacoustic imaging solution integrates:
- Microphone arrays
- Multi-channel synchronized acquisition
- OpenTest source localization
- Automated reporting workflows
within a single platform.
This enables wind tunnels to expand beyond traditional aerodynamic performance testing into areas such as:
- Vehicle wind-noise testing
- Rotor noise analysis
- Aeroacoustic component testing
- Acoustic source localization
A wind tunnel can therefore become more than a tool for observing airflow-it becomes a platform for understanding and controlling noise generation.
120-Channel Low-Speed Wind Tunnel Configuration
As an example, SonoDAQ provides a 120-channel acoustic imaging configuration specifically designed for low-speed wind tunnel applications.
The configuration is suitable for:
- Automotive wind-noise testing
- UAV and eVTOL development
- Aerospace component evaluation
- Wind turbine blade testing
- Ventilation and HVAC equipment analysis
For open-jet wind tunnels, the microphone array can be positioned beside, above, or at an oblique angle relative to the test object, while remaining outside the free-jet boundary to minimize flow-induced interference.
This arrangement provides sufficient aperture and viewing geometry for high-quality acoustic imaging.
The modular architecture of the SonoDAQ platform also allows future expansion as testing requirements evolve, enabling facilities to scale from initial deployments to large-channel aeroacoustic laboratories.
Conclusion
The value of wind tunnel acoustic testing is evolving from simply measuring sound to understanding sound.
When aeroacoustic noise can be accurately localized, analyzed, compared, and documented, the wind tunnel becomes far more than an aerodynamic performance validation tool. It becomes a critical platform for supporting low-noise design, structural optimization, and product development.
The SonoDAQ large-array aeroacoustic imaging solution combines:
- High-channel-count synchronized acquisition
- Non-uniform microphone arrays
- Acoustic source localization
- Operating-condition data integration
- OpenTest analysis and reporting workflows
into a unified platform for aeroacoustic testing.
By helping wind tunnel facilities build sustainable, scalable, and deliverable aeroacoustic testing capabilities, the system enables engineers to not only see the flow, but also truly hear the noise source. If you are interested, please submit the Get in Touch form below.
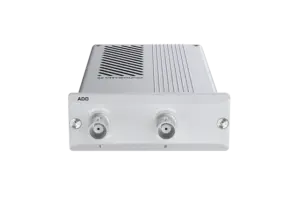
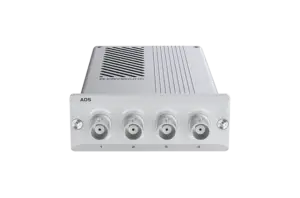
CRY5085 Analog Output Class D 10W - ADD
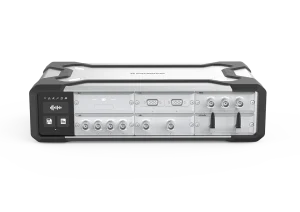
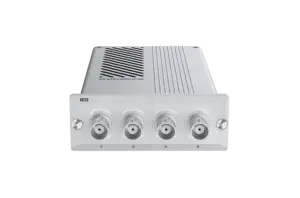
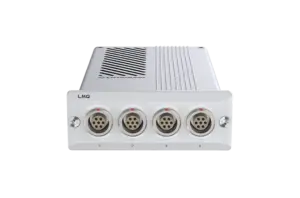
CRY5820 SonoDAQ Pro

OpenTest
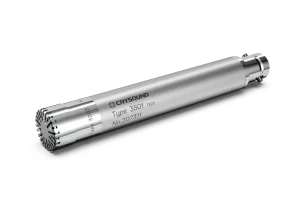
CRY3203-S01 Free-Field Microphone Set, 1/2", 50mV/Pa
CRY3018 Sound Calibrator
CRY5085 Analog Output Class D 10W - ADD
CRY5820 SonoDAQ Pro
OpenTest
CRY3203-S01 Free-Field Microphone Set, 1/2", 50mV/Pa


