Blogs

CRYSOUND acoustic imaging camera detecting floating partial discharge in MV switchgear

Floating Partial Discharge in MV Switchgear: Detection and Repair Case Study

Partial discharge (PD) signals were detected in the medium-voltage switchgear of a plant, raising concerns about the safety and stability of the electrical system. To ensure safe inspection, the technical team isolated the affected area by cutting power. Corrective measures included applying high voltage from an external source to the equipment and using advanced detection tools to accurately identify the location and root cause of the discharge. During the investigation, two main methods were employed to detect and analyze PD signals: Ultrasound Transient Earth Voltage (TEV) Detection and Diagnosis Floating Partial Discharge (PD) signals were detected at the medium-voltage switchgear panels of a plant using EA UltraTEV Plus² with Ultrasound and Transient Earth Voltage (TEV) methods. However, the exact location of the PD could not be determined. Figure 1. TEV measurement showing a 30 dB floating pattern in MV switchgear, indicating likely internal partial discharge. Figure 2. Ultrasound measurement showing a 26 dBμV PD pattern in MV switchgear with clustered discharge activity. Pinpointing the Source with CRY2623 To further investigate, high voltage from an external source was applied to the circuit breaker within the open switchgear panel. The CRYSOUND CRY2623 device — capable of recording partial discharge signals in the form of images, sound, and diagrams — was then used to visually and accurately identify the precise source of the discharge signals. As a result, the plant's power outage time was significantly reduced. Figure 3. CRY2623 acoustic imaging locating floating PD at the upper pole field deflector of the circuit breaker. Root Cause Identified The source of PD signal was identified at the field deflectors of the upper pole of the circuit breaker. Upon inspection, it was discovered that the field deflector was loose and showed signs of no contact with the busbar, due to the rubber O-ring beneath the deflector being thinner than the design specification. Figure 4. Inspection showing the thin O-ring beneath the field deflector, identified as the root cause of floating PD. Verification After Repair A thicker rubber O-ring was installed as a replacement. After re-energizing the equipment, the partial discharge (PD) signal was rechecked to verify improvement. Figure 5. Repair showing replacement with a thicker O-ring beneath the field deflector to correct floating PD. Figure 6. Post-repair ultrasound and TEV results showing noise-level ultrasound and 5 dB TEV with no concern. The CRYSOUND CRY2623 acoustic imaging camera enables engineers to accurately localize partial discharge sources in real time - reducing diagnostic time, minimizing unplanned downtime, and keeping your electrical systems running safely. Whether you're dealing with switchgear, transformers, or cables, the CRY2623 delivers fast, reliable fault detection so you can act before small issues become costly failures. Interested in learning more? Fill in the Get in touch form below and our team will get back to you shortly. About the Author PSTS (Vietnam) – PSTS is a trusted partner providing industrial maintenance equipment (online and offline) and advanced CBM solutions to enhance customer asset safety and reliability throughout their life cycle. Website: https://psts.co

CRY3213: The NVH Microphone That Goes Where Others Can't

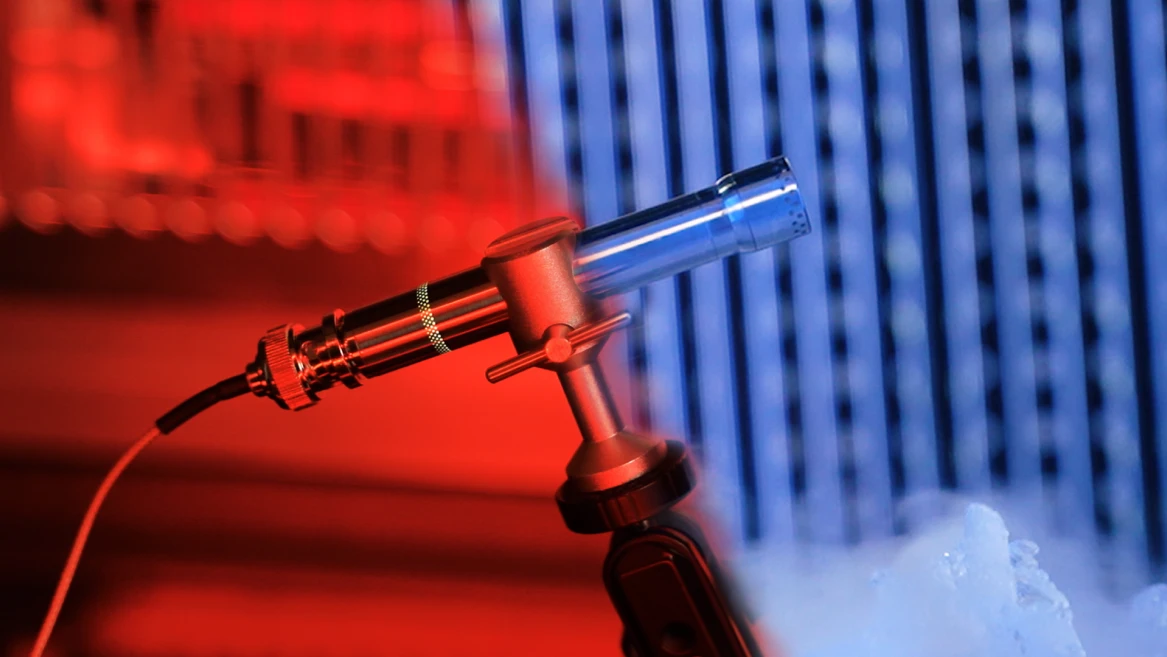
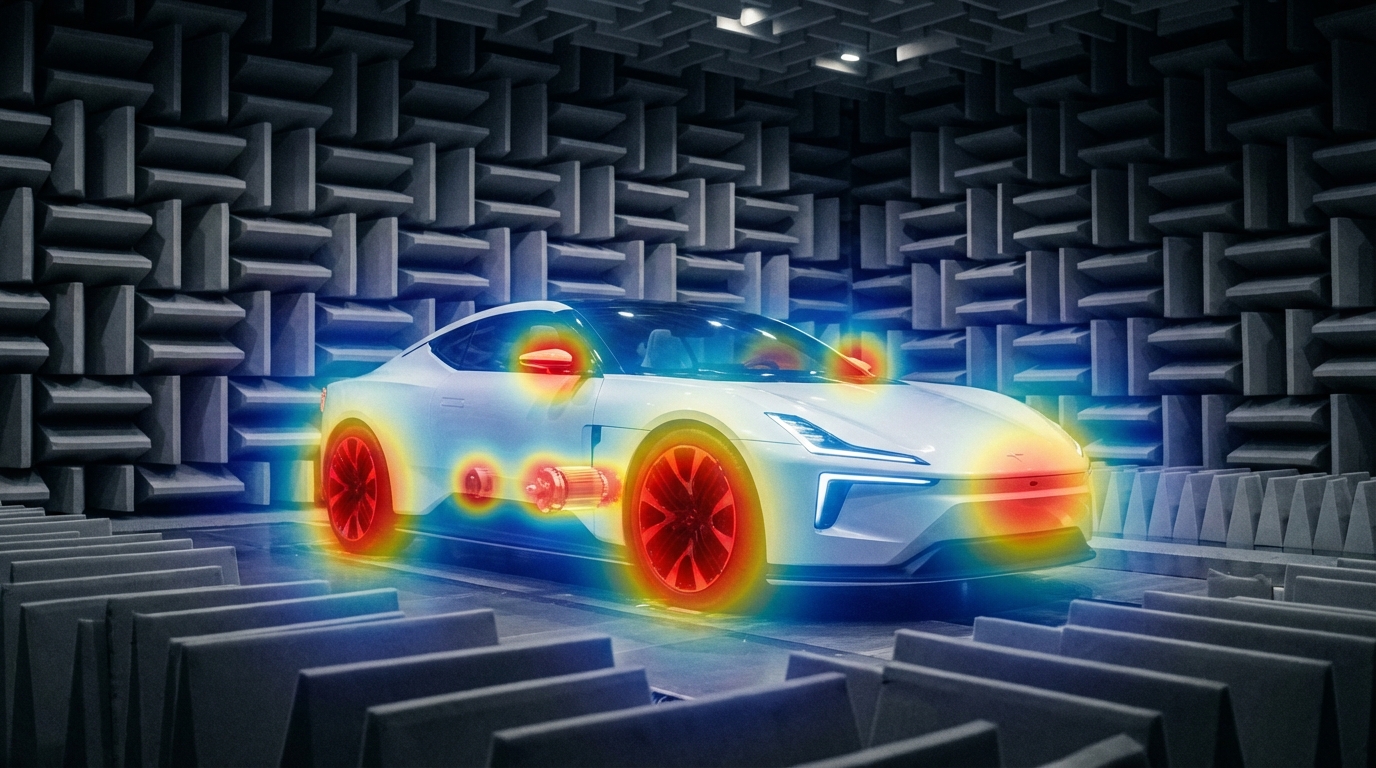
CRY3213 is a 1/2-inch prepolarized free-field microphone engineered for NVH testing in the real world — rain, dust, engine bay heat, Arctic cold. With IP67 protection and a -50°C to +125°C operating range, it delivers lab-grade accuracy without compromise, from powertrain noise to road and wind noise measurements. The Problem With Traditional Microphones Every NVH engineer knows the frustration: you need accurate acoustic data, but the test environment is anything but laboratory-perfect. Rain. Dust. Engine bay heat at 120°C. Scandinavian winter at -40°C. Vibration. Shock. Road spray. Traditional measurement microphones weren't built for this. They're precision instruments designed for controlled environments — fragile, temperature-sensitive, and one drop away from an expensive recalibration. So engineers compromise: they protect the microphone instead of optimizing the measurement, or they accept degraded data from sensors pushed beyond their limits. CRY3213 changes this equation entirely. Figure 1. CRY3213 operating in harsh road test conditions — water, mud, and debris are no obstacle A Game Changer for NVH Testing The CRY3213 is the NVH measurement microphone that delivers laboratory-grade accuracy in the harshest real-world conditions — without compromise, without babysitting, without excuses. This isn't an incremental improvement. It's a new category: the ruggedized precision NVH microphone. FeatureWhat It Means for Your Testing-50°C to +125°C operating rangeTest in Arctic cold or next to a turbo manifold — same accuracy, same reliabilityIP67 dust & water protectionContinue operating in rain, road spray, temporary water immersion, sand and dust — without extra protectionRuggedized, vibration-resistant designSurvives the shocks and vibrations of real-world vehicle testing without signal degradation50 mV/Pa sensitivityHigh output for excellent signal-to-noise ratio, even in quiet cabin measurements3.15 Hz – 20 kHz (±2 dB)Full audible bandwidth plus infrasound — captures everything from tire cavity resonance to HVAC hiss Figure 2. CRY3213 performing in extreme weather road testing Why CRY3213 Is Different Extreme Temperature Performance Most measurement microphones spec a conservative operating range. That's fine for a lab. It's useless for: Cold climate testing in Arjeplog, Sweden (-35°C) or Northern China (-40°C) Under-hood measurements where temperatures routinely exceed 100°C near exhaust manifolds and turbochargers Thermal cycling tests that swing from frozen to furnace in minutes CRY3213 operates at -50°C to +125°C with specified accuracy. No warm-up drift. No thermal shutdown. No recalibration needed between temperature extremes. When your competitors are swapping frozen microphones in the parking lot, your CRY3213 is still collecting data. IP67: Truly Weatherproof IP67 means:- 6 = Total dust ingress protection (dust-tight)- 7 = Protected against temporary immersion in water (up to 1 meter, 30 minutes) For NVH testing, this translates to:- Pass-by noise testing in rain — no test cancellations, no scrambling for covers- Road spray and puddle testing — mount microphones at wheel height without worry- Tropical humidity environments — no condensation-related signal drift- Outdoor long-term monitoring — deploy and forget CRY3213's IP67 is the highest protection class available in a precision NVH microphone. Figure 3. CRY3213 IP67 waterproof immersion testing Ruggedized and Vibration-Resistant Traditional condenser microphones are inherently precise and delicate. The CRY3213 has been systematically reinforced at the structural level for field durability, allowing it not only to measure near the vehicle, but also to be mounted directly on the vehicle for testing. Shock-resistant structural design helps withstand field handling and repeated installation/removal. Power-on LED indication enables quick confirmation of the microphone's operating status. Vibration-isolated design helps suppress mechanical interference transmitted through test benches and vehicle structures. The cable and connector system is designed for frequent connection, disconnection, and field deployment. No-Compromise Acoustic Performance Ruggedized doesn't mean reduced performance. CRY3213 delivers: Sensitivity: 50 mV/Pa (-26 dB re 1V/Pa) — matching premium lab microphones Frequency Response: 3.15 Hz to 20 kHz (±2 dB) — the full NVH bandwidth Dynamic range 17 to 136 dB — handles everything from quiet cabin to high-SPL engine bay measurements Low-frequency extension to 3.15 Hz — critical for tire cavity resonance (180–250 Hz), body boom (30–60 Hz), and powertrain low-order vibrations Prepolarized design — no external polarization voltage needed; plug-and-play with any IEPE/CCP input Application Scenarios Automotive NVH — Where CRY3213 Shines ApplicationChallengeCRY3213 AdvantagePowertrain NoiseEngine bay, 80–120°C, heavy vibrationTemperature range + vibration resistanceRoad Noise TestingOutdoor, all weather, road sprayIP67 + wide temperature rangeWind Noise TestingWind tunnel or outdoor, high airflowRuggedized + dust protectionPass-by Noise (ISO 362)Outdoor, rain or shine, year-roundIP67 enables all-weather testingCold Climate ValidationArctic conditions, -30°C to -50°C-50°C low-end operating rangeEV Motor Whine AnalysisNear e-drive, electromagnetic interferenceHigh sensitivity + vibration isolationSqueak & RattleInterior, door panels, dashboardFull bandwidth down to 3.15 HzProduction Line EOL TestFactory floor, dust, temperature swingsIP67 + rugged design for 24/7 industrial use Beyond the automotive industry, the CRY3213 is also well suited to aerospace, rail transportation, heavy industry, and the energy sector. Typical applications include engine ground run testing, interior and exterior train noise measurements, compressor and turbine noise monitoring, and wind turbine noise assessment under extreme weather conditions. Figure 4. CRY3213 installed in engine bay for powertrain noise testing Technical Specifications ParameterSpecificationType1/2" Free-field, PrepolarizedIEC StandardIEC 61094 WS2FSensitivity (±2 dB)50 mV/Pa, -26 dB re 1V/PaFrequency Response (±2 dB)3.15 Hz – 20 kHzDynamic Range (re. 20 µPa)17 dB(A) – 136 dBPower SupplyIEPE (2–20 mA)ConnectorBNCOperating Temperature-50°C to +125°CStorage Temperature-25°C to +70°COperating Humidity0–90% RH, non-condensingIP RatingIP67 (dust-tight, waterproof)Dimensions (with grid)Ø14.5 mm × 92 mmPolarization0 V (prepolarized)Weight36 g Frequently Asked Questions Q: Can I use CRY3213 with my existing NVH data acquisition system?A: Yes. CRY3213 is a prepolarized (0V) IEPE/CCP microphone, compatible with any standard constant-current input — including systems from SonoDAQ, CRY6151B, Siemens (SCADAS), HBK (LAN-XI), Dewesoft, National Instruments, HEAD acoustics, and others. Q: How does it handle rapid temperature changes during thermal cycling tests?A: CRY3213 is designed for continuous operation across its full -50°C to +125°C range, including rapid transitions. The thermal compensation ensures sensitivity stability without requiring recalibration between temperature extremes. Q: Is it suitable for permanent outdoor installation?A: Yes. With IP67 protection, CRY3213 is suitable for long-term outdoor deployment. Q: What's the advantage over ordinary microphones for NVH?A: Compared with conventional microphones, the CRY3213 NVH microphone not only delivers more accurate measurements, but is also better suited for real-world testing conditions. With IP67 protection, an operating temperature range of -50°C to +125°C, and excellent resistance to vibration and shock, it can operate reliably in rain, dust, high heat, and extreme cold, making it ideal for vehicle road tests, under-hood measurements, and long-term outdoor monitoring. Q: 10-year warranty — what does it cover?A: CRYSOUND's 10-year warranty covers manufacturing defects and sensitivity drift beyond specification. It's one of the longest warranties in the measurement microphone industry, reflecting our confidence in CRY3213's long-term reliability. Ready to Upgrade Your NVH Testing? Stop compromising between precision and durability. CRY3213 delivers both. Request a Quote → Download Datasheet (PDF) → Compare All CRYSOUND Microphones →
Data center noise compliance monitoring with sound level meter

Data Center Noise Compliance: How 24/7 Monitoring Helps Avoid Fines

CRYSOUND's CRY2830 Series sound level meters support 24/7 data center noise monitoring, helping operators maintain noise compliance records and reduce the risk of fines. As AI workloads surge and hyperscale facilities continue to expand, data center noise complaints are rising rapidly. At the same time, environmental noise regulations are becoming more stringent. In Europe, more than 109 million people - about 20% of the population - are exposed to environmental noise above 55 dB(A). Driven by compliance requirements, the acoustic analysis services market is also growing quickly, with a projected CAGR of 6.4% through 2035. This is no longer just a matter of being a good neighbor. It is now a hard compliance requirement. Without continuous monitoring, operators are essentially flying blind. Figure 1. Site overview related to data center noise monitoring and property boundary compliance. Why Data Center Noise Is Becoming a Regulatory Priority Data center noise is not just annoying - it is a public health issue. The World Health Organization has noted that chronic noise exposure above 53 dB Lden is associated with significantly higher risks of hypertension, stroke, and heart attack. Regulations in multiple regions are tightening at a visible pace: LocationRegulationKey RequirementAurora, IL, USANew Data Center Ordinance (2026)24/7 automatic noise monitoring at the property line; daytime limit of 55 dB(A), nighttime limit of 45 dB(A)Prince William County, VA, USANoise Ordinance Update (2025)Noise limits for data centers; fines of $250-$500 per violationEuropean UnionEnvironmental Noise DirectiveNoise mapping, action plans, and a 55 dB(A) Lden threshold The trend is clear: what used to rely on self-discipline is quickly becoming a legal obligation. Figure 2. Environmental context relevant to data center noise compliance and surrounding sensitive areas. The Real Cost of Non-Compliance A fine of $250 to $500 per violation may not look serious for billion-dollar operators, but the actual cost goes far beyond the amount of the penalty itself: Project delays and permit rejection: Projects that cannot prove noise compliance at the planning stage may be rejected or delayed indefinitely. High retrofit costs: Emergency installation of acoustic enclosures after community complaints is extremely expensive, while early sound level assessment during design and operation can prevent that cost. Damage to reputation and community relations: Noise complaints erode community goodwill faster than almost any other issue. Operational restrictions: Some ordinances may force operators to reduce cooling capacity at night, directly affecting uptime and SLA commitments. Using the CRY2830 Series to Take Control Continuous noise monitoring is not only about compliance - it is about proactive control. For the demanding requirements of 24/7 outdoor monitoring in data centers, ordinary handheld instruments are not enough. The CRYSOUND CRY2830 Series sound level meters, when used with the dedicated outdoor protection kit, provide a practical high-accuracy solution for long-term compliance monitoring. Meets international standards for defensible reporting The foundation of compliance is reliable and legally defensible data. The CRY2833 sound level meter meets IEC 61672-1:2013 Class 1 requirements, helping ensure that reports submitted to regulators are credible, traceable, and technically sound. Outdoor protection for long-term boundary monitoring A sound level meter used at the property boundary must operate continuously in outdoor conditions. When paired with the NA41 outdoor protection kit, the system reaches IP65 protection, helping resist dust and water splashes. Its windscreen can still reduce wind noise by more than 30 dB at 10 m/s, which is especially important for capturing real equipment noise in harsh weather conditions. Figure 3. CRY2833 and CRY2834 with windscreen for outdoor data center noise monitoring. Captures low-frequency hum with octave analysis One of the most common complaints around data centers is the low-frequency hum generated by cooling equipment in the 63-250 Hz range. Standard A-weighted measurement can underestimate this problem. The CRY2830 Series supports both 1/1 octave and 1/3 octave analysis, making it easier to identify and evaluate these hidden low-frequency noise sources. Continuous logging and alarm-ready monitoring The system includes a built-in 32 GB microSD card for continuous data logging, with data automatically saved in standard CSV format. This makes it easier to build long-term compliance records and export measurement data for review. Flexible connectivity and system integration The CRY2830 Series also offers multiple interfaces, including Bluetooth, WiFi, RS232, and USB, making it easier to integrate sound level data into an existing BMS or cloud dashboard for remote access and long-term management. Figure 4. CRY2833 and CRY2834 interface options for data logging and system integration. Best Practices for Deployment Start with a baseline survey: Before installing permanent monitoring equipment, carry out a full noise survey to establish background noise levels and identify dominant noise sources. Use strategic placement with outdoor protection: Deploy the CRY2833 with the NA41 outdoor protection kit at property boundary points closest to sensitive receivers such as residential areas. Monitor low-frequency noise and use smart triggers: Enable 1/3 octave analysis to flag low-frequency issues and set threshold-based triggers for automatic recording when needed. Generate compliance-ready records: Export standard CSV measurement data regularly so that you have a defensible record available for any future noise complaint or regulatory review. Conclusion The data center industry is reaching a turning point. Regulations are tightening, and the cost of non-compliance already far exceeds the investment required for a professional sound monitoring system. 24/7 sound level monitoring is not a regulatory burden - it is an operational advantage. It gives operators better data, better decisions, stronger community relations, and written proof that they are doing the right thing. To learn more, explore the CRY2830 Series and contact CRYSOUND for a customized data center noise compliance solution.
Electric vehicle in anechoic chamber with acoustic beamforming heatmap overlay

EV NVH Testing Challenges: Why Acoustic Cameras Are Becoming Essential

Traditional NVH tools still matter, but they don't cover every EV scenario—acoustic cameras fill the gap with real-time noise visualization and wide-band diagnostics. The Quiet EV Paradox: Why Electric Cars Are Actually "Noisier" It sounds like a paradox — electric vehicles have no roaring engine, yet engineers are finding it harder than ever to achieve a truly quiet cabin. The truth is, when the low-frequency masking effect of the internal combustion engine disappears, every previously hidden noise becomes fully exposed: the high-frequency whine of the electric motor, the electromagnetic hum of the inverter, gear meshing vibrations, wind noise, road noise, even the squeak and rattle of interior trim — nothing can hide anymore. This isn't just a comfort issue. It's fundamentally redefining the automotive industry's approach to NVH (Noise, Vibration, and Harshness) testing. The global automotive NVH testing market is projected to grow from USD 3.51 billion in 2026 to USD 5.75 billion by 2034, at a CAGR of 6.4%. The core driver behind this growth? The electrification revolution. What New Noise Challenges Do EVs Bring? A Fundamental Shift in Frequency Range Traditional ICE vehicle NVH work focuses on the 20–2,000 Hz low-frequency range — engine firing, exhaust systems, crankshaft vibrations. Electric vehicles are fundamentally different: Noise SourceTypical Frequency RangeCharacteristicsElectric motor electromagnetic noise500–5,000 HzSharp tonal noise, varies linearly with speedInverter switching noise4,000–10,000+ HzHigh-frequency hum, related to PWM frequencyGear meshing noise800–3,000 HzParticularly prominent in single-speed reducersBattery charger noise8,000–20,000 HzNear-ultrasonic range, at the edge of human perceptionWind / Road noise200–4,000 HzHighly exposed without engine masking ICE vs EV: The fundamental shift in noise frequency characteristics Key insight: EV noise problems shift from low frequencies to mid-high frequencies (and even ultrasonic ranges). The 100Hz-5kHz range is where most critical NVH issues reside—precisely where human hearing is most sensitive. Traditional NVH testing methods and frequency ranges may no longer be sufficient. New Noise Sources, New Localization Challenges In the ICE era, the assumption that "the engine is the dominant noise source" made things relatively straightforward. In EVs, noise sources become more distributed and complex: Electric drive system: The motor + inverter + reducer form a highly coupled noise system Thermal management: Battery cooling pumps and fans become dominant noise sources at low speeds Regenerative braking: Changes in inverter operating modes during energy recovery produce transient noise Structural transmission paths: Lightweight body structures (aluminum alloy, carbon fiber) have fundamentally different sound insulation characteristics compared to traditional steel This means engineers face a core challenge: How do you quickly and accurately locate the root cause among multiple distributed, dynamically changing noise sources? Sound Quality Design: From "Reducing Noise" to "Crafting Sound" NVH engineering in the EV era is no longer just about "minimizing noise." Consumers expect a carefully designed sound experience: Acceleration should feel "high-tech" without being harsh The cabin should be quiet, but not so silent that it makes the driver uneasy Different driving modes (Sport / Comfort / Eco) should deliver differentiated acoustic feedback This demand for "Sound Design" is expanding NVH testing from pure engineering validation into subjective sound quality evaluation and brand-level acoustic identity. Why Acoustic Cameras Are Becoming Essential for EV NVH Facing these new challenges, traditional NVH testing tools — single-point microphones, accelerometers — remain important but are no longer sufficient for every scenario. Acoustic cameras are filling this gap. Core Advantages of Acoustic Cameras 1. Real-Time Noise Source Visualization Traditional methods require densely placing microphone arrays on the target object — time-consuming and labor-intensive. Acoustic cameras use beamforming technology to generate a noise source heatmap in a single capture, instantly showing "where the noise is and how loud it is." Typical scenario: An EV prototype running on a test bench, the acoustic camera aimed at the electric drive system, instantly revealing that an 800 Hz resonance originates primarily from the right side of the motor — the entire localization process takes less than 5 minutes. Engineer conducting noise source localization test Automotive NVH detection and optimization 2. Wide Frequency Coverage EV noise spans from hundreds of hertz (gear meshing) to tens of thousands of hertz (inverter switching noise) — an enormous frequency range. Critical consideration for NVH: Most EV noise issues occur in the 100Hz-5kHz range—gear meshing, motor electromagnetic noise, wind leaks, HVAC systems. Traditional acoustic imaging cameras (limited to frequencies above 5 kHz) cannot capture these noise sources. Take the CRYSOUND SonoCam Pi (CRY8500 Series) as the ideal example: its 208 MEMS microphone array provides: Beamforming frequency range: 400 Hz - 20 kHz (covers the entire NVH audible spectrum) Near-field acoustic holography range: 40 Hz - 20 kHz (captures low-frequency road noise and structural vibration) Array size: >30 cm (optimized for low-frequency spatial resolution) This makes SonoCam Pi uniquely suited for full-spectrum EV NVH testing—from low-frequency road noise to high-frequency motor whine, all in a single handheld device. 3. Non-Contact Measurement EV electric drive systems are highly integrated and spatially compact. The non-contact measurement approach of acoustic cameras means: No disassembly of any components required No interference with the operating state of the system under test Rapid quality inspection directly on the production line 4. Portability Modern handheld acoustic cameras like the SonoCam Pi can be taken directly to proving grounds, production lines, or customer sites, no complex setup required. Typical Application Scenarios in EV NVH ScenarioApplicationE-drive system NVHLocating order-based noise contributions from motors, inverters, and reducersPass-by noise testingAnalyzing noise source distribution as vehicles pass byInterior squeak & rattle trackingLocating noise from dashboards, doors, seats, and trimEnd-of-line production QCRapid online detection of abnormal noise, replacing subjective human judgmentWind tunnel / Semi-anechoic chamberHigh-precision noise source localization and sound power analysis Real-World Case Study: OEM Dynamic Road Testing Client: A leading Chinese OEMLocation: An OEM test center, internal test trackObjective: Identify in-cabin noise sources during dynamic driving conditions CRY8500 Series SonoCam Pi acoustic cameras Test Setup Device:SonoCam Pi acoustic camera Measurement positions:Rear seat and front passenger seat Target areas:Left and right B-pillars (rear cabin area) Test mode:Beamforming app Frequency range:3,550 Hz - 7,550 Hz Dynamic range:5 dB Key Results SonoCam Pi successfully localized noise sources in real-time during vehicle motion, providing actionable data for OEM's NVH engineering team. The test demonstrated: Real-time localization during dynamic conditions: Unlike fixed laboratory setups, SonoCam Pi captured noise distribution while the vehicle was in motion on the test track Precise frequency-band analysis: By focusing on the 3,550-7,550 Hz range (critical for perceived cabin noise), engineers pinpointed specific contributors rather than measuring overall SPL Rapid testing workflow: Complete B-pillar area scan in minutes, not hours Noise Source Localization Results Key Insight: Traditional microphone arrays would require the vehicle to be stationary in a semi-anechoic chamber. SonoCam Pi enabled on-track diagnostics, dramatically reducing testing time and enabling rapid iteration during vehicle development. Future Trends — What's Next for EV NVH Testing? AI-Driven Noise Classification Machine learning is being integrated into NVH testing workflows: automatically identifying noise types, determining whether anomalies exist, and predicting potential quality issues. The high-dimensional data captured by acoustic cameras is naturally suited for AI analysis. Digital Twins and Simulation-Test Integration Simulation (CAE) predicts noise performance → Acoustic camera validates through physical measurement → Data feeds back to optimize the simulation model. This closed-loop approach is becoming the standard workflow for major OEMs. New Challenges in the Solid-State Battery Era Solid-state batteries have different mechanical properties compared to liquid lithium-ion batteries. Their vibration transmission characteristics and thermal management approaches will introduce new NVH challenges. Stricter Regulations Pass-by noise testing is the fastest-growing NVH sub-segment (CAGR 7.11%), with UNECE pushing for stricter standardized testing requirements, including indoor pass-by testing protocols. Conclusion: The Value of Acoustic Testing, Redefined for the EV Era Electrification hasn't made cars quieter — it has made noise challenges more complex, more nuanced, and more valuable to solve. For automotive OEMs, Tier 1 suppliers, and testing service providers, investing in the right NVH testing equipment is no longer a "nice-to-have" — it's foundational infrastructure for competitiveness. Acoustic cameras—especially those capable of capturing the critical 100Hz-5kHz NVH frequency range—are evolving from "useful auxiliary tools" to "indispensable standard equipment." The CRYSOUND SonoCam Pi stands out as the only handheld acoustic camera that combines: Low-frequency capability (400 Hz beamforming, 40 Hz holography) High spatial resolution (208 microphones, >30 cm array) Near-field + far-field measurements in a single system Portability (handheld, <3 kg, production-ready) Learn more: CRYSOUND SonoCam Pi (CRY8500 Series) → Contact us for NVH testing solutions →

IMU Test for Spatial Audio

Spatial audio performance can vary significantly across devices—even when similar audio algorithms are used. This article explains the role of the IMU in spatial audio, outlines key IMU testing challenges, and introduces CRYSOUND's production-ready IMU testing solution based on a three-axis, three-degree-of-freedom (3-DoF) rotary table. You'll learn the working principles, test flow, and application scenarios to help ensure stable and consistent spatial audio performance in mass production. The Role of IMU in Spatial Audio: From Hearing Sound to Perceiving Space In recent years, spatial audio has become a key feature in TWS earbuds, over-ear headphones, and AR/VR devices. Users now expect more than conventional stereo sound—they want to perceive sound direction and distance in a natural, three-dimensional space. When the head turns, the sound source should remain fixed in space; when the head tilts or nods, the sound field should respond accordingly. To achieve this effect, a device must not only render spatial audio content, but also accurately understand how the user's head is moving in real time. This capability is enabled by the IMU (Inertial Measurement Unit). An IMU integrates gyroscopes and accelerometers to measure angular velocity, acceleration, and orientation. In spatial audio systems, it serves as the core sensor that tracks head motion and feeds motion data into spatial audio algorithms. If the IMU lacks accuracy or stability, or if it does not align well with the audio algorithm, users may experience common issues such as: Response latency: the sound field lags behind head movement, causing discomfort or even mild dizziness; Tracking drift: sound positioning gradually shifts over time and no longer remains spatially fixed; Instability and jitter: noisy IMU output causes audible fluctuations in sound position. As immersive audio, AR experiences, and spatial communication continue to evolve, audio devices are transforming from simple playback tools into intelligent perception systems. As a result, IMU stability and test quality have become foundational requirements for next-generation spatial audio products. Three Major Challenges in IMU Testing for Spatial Audio Despite the importance of IMU performance, testing and validating IMUs is often underestimated during development and mass production. In practice, the industry commonly faces three core challenges: Lack of objective test methods tailored to spatial audio Traditional audio testing focuses on metrics such as frequency response, distortion, and sensitivity. These methods are not suitable for evaluating dynamic spatial perception, and subjective listening tests or manual motion checks lack objective and repeatable standards. Inability to reproduce real head movements with high precision Spatial audio relies heavily on head movements such as turning, nodding, and tilting. Manual rotation cannot maintain consistent angles or speeds, nor can it reliably repeat motion patterns across devices. Without precise and repeatable motion simulation, IMU issues may go undetected before products reach users. Low testing efficiency, making full inspection impractical Manual testing is time-consuming and inconsistent. In mass production, it often forces manufacturers to rely on sampling inspection instead of full inspection, increasing the risk of quality variation. At their core, these challenges stem from the absence of a controllable, repeatable, and quantifiable IMU orientation testing method. Overview of CRYSOUND's Spatial Audio IMU Testing Solution To address these challenges, CRYSOUND has developed an IMU testing solution specifically designed for spatial audio and smart wearable applications. The goal is to provide an objective, automated, and production-ready testing approach. The system consists of: PC-based test software for test control, data acquisition, and analysis; A three-degree-of-freedom rotary table for simulating head motion; Communication interfaces (such as a Bluetooth adapter) for data exchange; Shielded enclosure and customized fixtures to ensure stable connections and safe device mounting. During a typical test, the host software establishes a connection with the device under test via Bluetooth or a wired interface, then sends commands to enable IMU data output. The rotary table sequentially moves to predefined orientations, while IMU data is collected and compared against reference angles. The entire process is automated, requiring the operator only to place the device and start the test, minimizing training effort and human error. Key Hardware: Why a Three-DoF Rotary Table Is Ideal for IMU Testing In spatial audio IMU testing, a three-degree-of-freedom rotary table provides a highly controllable and production-friendly solution. It accurately reproduces head movements across all three orientation axes and ensures consistent motion paths through programmatic control. Compared with manual operation or simplified mechanical setups, a 3-DoF rotary table offers higher repeatability, better control over angle and speed, and more stable test cycles—making it well suited for mass production environments where consistency and throughput are critical. The three axes correspond to common head motions: Yaw axis: simulates left-right head rotation; Pitch axis: simulates nodding movements; Roll axis: simulates head tilting. The rotary table achieves an absolute positioning accuracy of ±0.05° and a repeatability of approximately ±0.06°, providing a reliable reference for evaluating IMU orientation accuracy. System Features: How the Solution Addresses Real Production Needs Building on this hardware and automated workflow, CRYSOUND's IMU testing solution delivers value in several key areas: High-precision motion simulationServo-driven control and three-axis motion allow precise and repeatable reproduction of head movements, eliminating the uncertainty inherent in manual testing. Controlled test speed and production throughputWith a maximum rotational speed of up to 200°/s and efficient Bluetooth communication, a six-orientation IMU test can be completed in approximately 60 seconds per unit, making full inspection feasible in production. Objective and quantifiable evaluationIMU output data is directly compared against known reference angles, reducing reliance on subjective judgment. Test results can be exported as reports or raw data and support MES integration for production tracking and quality analysis. Typical Application Scenarios This IMU testing solution is designed for manufacturers working with spatial audio and smart wearable products, including: Bluetooth earbuds and headphones, especially TWS and over-ear models with spatial audio features; VR controllers or devices requiring multi-orientation consistency checks; Smartphones and other consumer electronics requiring gyroscope validation; Smartwatches and fitness bands for IMU calibration and production testing. If you'd like to learn more about IMU testing—or discuss your blade process and inspection targets—please use the "Get in touch" form below. Our team can share recommended settings and an on-site workflow tailored to your production conditions.
Support Support
Product Catalogs Product Catalogs Solutions Solutions User Manuals User Manuals Software Download Software Download Product Inquiry Product Inquiry Schedule Demo Schedule Demo Technical Support Technical Support +86-571-88225128 +86-571-88225128
Request Quote 0
Request Quote