Blogs

Compressed air leaks visualized in an industrial plant using a tablet-style acoustic imaging camera

How Much Are Air Leaks Costing Your Plant? (Use Our Free Calculator)

By Bowen · Application Engineer at CRYSOUND Compressed air leaks rarely announce themselves as a major failure. More often, they sit in the background: a hiss at a fitting, a loss point on an overhead run, a manifold that never seems quite stable, a line that stays pressurized when it does not need to. Small individually. Expensive in aggregate. That is why leaks are easy to underestimate. They do not always stop production, but they do keep drawing power and eroding usable system capacity day after day. The U.S. Department of Energy and ENERGY STAR both note that leaks can account for roughly 20% to 30% of compressed air system output in a typical plant, and ENERGY STAR adds that poorly maintained systems may lose 20% to 50% of their compressed air to leaks. A compressed air leak cost calculator can help quantify that burden. Once losses reach that range, the issue is no longer housekeeping. It is an operating-cost problem and a maintenance-priority problem. Why air leaks cost more than they look Air leaks cost more than they look because they consume both electricity and capacity. The obvious loss is energy: compressors are producing air the plant never uses. The less obvious loss is system headroom. When enough air escapes through avoidable leaks, the plant may start seeing pressure instability, slower recovery after peak demand, or equipment that feels short of air even though compressor capacity on paper should be adequate. That is why leaks often surface as symptoms before they are treated as root causes. Teams may notice unstable downstream pressure, poor actuator response, longer recovery time, or compressors that seem to be working harder than expected. The first reaction is often to adjust pressure setpoints, add capacity, or tune controls. Sometimes the simpler truth is that too much air is leaving the system before it ever reaches productive use. Compressed air leak cost: the yearly operating cost associated with compressed air that your system generates, but your plant never uses because it escapes through avoidable leaks. ENERGY STAR draws a useful contrast here. In a plant with an active leak program, losses may be kept below 10%. In a poorly maintained system, the leak share can be far higher. That gap turns leaks from background noise into a measurable operating expense. Where compressed air leaks usually hide in real plants In most plants, compressed air does not disappear through one spectacular failure. It leaks away through ordinary connection points that are easy to ignore because each one looks minor on its own. Typical leak locations include: quick-connect fittings and couplings hoses and hose-end connections threaded joints FRL assemblies and valve manifolds drains, traps, and condensate components aging seals in cylinders or actuators idle machines that stay pressurized when they do not need to be overhead distribution lines that are physically hard to inspect Some of these are simple bench-level fixes. Others are difficult mainly because of access and visibility. Overhead piping, dense manifolds, crowded mechanical spaces, and background noise all make it harder to localize the exact point of loss quickly. That is one reason leak programs stall even when everybody agrees the system probably has leaks. Why teams know leaks exist but still struggle to fix them Most plants do not lack awareness. They lack a repeatable path from suspicion to action. There are several reasons for that: the leak burden is spread across many assets rather than one dramatic failure background plant noise makes traditional listening unreliable overhead or crowded geometry slows inspection maintenance teams are asked to prioritize problems that look more urgent leadership may not see a clear financial case for dedicating time to a leak campaign Leak programs often fail at the handoff between engineering intuition and operational prioritization. The maintenance team may know leaks are present. The plant may even hear them. But if nobody can frame the cost clearly enough to justify time, and nobody can localize the leaks efficiently enough to repair them, the issue stays on the backlog. A calculator helps with the first half of that problem. It does not solve the leak. It tells the plant whether the leak problem is large enough to deserve immediate attention. Use our free calculator to estimate the business impact This article includes a lightweight compressed air leak cost calculator for that decision point. It is meant to answer one practical planning question: If our leak burden is in a realistic range, what could it be costing us per year? It supports two simple input paths: Estimate from compressor data if you know installed power, electricity cost, and runtime assumptions Use annual electricity cost if you already know the approximate yearly electricity spend for your compressed air system Compressed Air ROI How much are air leaks costing your plant? Estimate the annual cost of compressed air leaks in less than a minute. Switch between a compressor-data estimate and a direct electricity-cost shortcut. Typical planning assumption 20% Estimated leak loss rate Use the leak-loss slider to model your plant. The calculator updates live so you can stress-test different assumptions before planning repairs. Estimate from compressor data Use annual electricity cost Input assumptions Use the path that best matches what you already know about your compressed air system. Currency Affects result formatting only USD ($) EUR (€) GBP (£) CNY (¥) Total installed compressor power HP kW Electricity cost per kWh Repair budget (optional) Operating days per week Operating hours per day Annual non-production days Currency Match your annual electricity cost input USD ($) EUR (€) GBP (£) CNY (¥) Annual compressed air electricity cost Repair budget (optional) Estimated annual cost of air leaks $0 Adjust the inputs to see how compressed air leaks can turn into recurring annual spend. Annual air-system electricity cost $0 Average monthly leak cost $0 Average daily leak cost $0 Estimated payback period — Planning estimate only. This calculator helps you frame the possible business impact of compressed air leaks. It does not replace a plant energy audit or a quantified leak survey. Want to find the leaks behind this cost? Acoustic imaging helps maintenance teams see compressed air leaks faster on manifolds, fittings, and overhead lines. See acoustic leak detection solutions Assumption note: leak-loss percentage is user-defined so teams can model conservative or aggressive scenarios. The key input is the estimated leak-loss rate. That percentage is intentionally scenario-based because plants start from very different conditions. A well-managed system may justify a lower case. A site with legacy piping, recurring fitting changes, idle assets left pressurized, and no regular survey routine may justify a higher one. Use the output for planning, not for forensic accounting. Its job is to convert a suspected problem into an estimated annual exposure that can support budgeting, prioritization, and a decision on whether a leak survey should move up the queue. Why finding the leak matters more than estimating it A cost estimate is only useful if it changes field behavior. Once a plant sees that leaks may be costing thousands or tens of thousands of dollars per year, the real operational question becomes: Can we find the leaks fast enough to repair them without turning the program into a slow manual hunt? This is where many leak initiatives bog down. Estimating cost is relatively easy compared with localizing leaks across real plant geometry. A few leaks near eye level may be obvious. A larger system with overhead runs, crowded manifolds, complex drops, and tight mechanical spaces is harder. Knowing that leaks exist is not the same as being able to repair them efficiently. Execution quality depends on localization speed. If finding leaks is painfully slow, even a strong energy-saving case can lose momentum. If localization is fast and repeatable, the plant can move much more confidently from estimate to inspection to repair. How acoustic imaging helps maintenance teams localize leaks faster DOE and ENERGY STAR guidance often point maintenance teams toward ultrasonic leak detection because escaping compressed air produces high-frequency sound that is easier to detect ultrasonically than by ear in a noisy environment. That is the right starting point. In the field, though, the hard part is often not detecting that sound. It is locating the exact source quickly on a live plant floor. Acoustic imaging helps by turning that signal into a visual map. Instead of relying only on point-by-point audio cues, the inspector can see where sound energy is concentrated on top of the live scene. On dense manifolds, fittings, hose assemblies, overhead lines, and hard-to-reach drops, that visual layer can make leak localization faster and easier to document. That is especially useful when: the suspected leak zone contains many possible connection points the leak is above eye level or across a congested mechanical area the team needs to document findings for a maintenance backlog multiple leaks must be ranked and repaired efficiently If you want a fundamentals refresher on the method itself, CRYSOUND already explains the basics in What Is an Acoustic Camera? and How Acoustic Imaging Works. Some acoustic imaging workflows also support leak-severity assessment, which matters when a plant is trying to prioritize repairs instead of treating every leak as equal. For plants doing regular compressed-air inspections, CRYSOUND's handheld lineup fits that workflow directly: the CRY8124 Advanced Acoustic Imaging Camera provides a higher-resolution handheld option with 200 microphones and a 2-100 kHz frequency range, while the CRY2623 128-Mic Industrial Acoustic Imaging Camera offers 128 microphones, a 2-48 kHz frequency range, and support for gas/vacuum leak detection and leak rating in a rugged industrial format. Plants do not buy inspection tools because leak math is interesting. They buy them because once the cost is visible, they need a practical way to find and fix the leaks behind the number. A practical workflow: estimate → inspect → repair → verify Once the plant accepts that leaks are carrying real cost, the next steps do not need to be complicated. Estimate the exposure. Use the calculator to test low, mid, and high leak-loss scenarios and decide whether the annual burden justifies focused action. Inspect the likely problem zones. Start with compressors, dryers, headers, manifolds, drops, hoses, valve packs, and idle equipment that stays pressurized. Repair the most valuable leaks first. Rank issues by probable severity, accessibility, safety, and operational impact rather than trying to fix everything at once. Verify and repeat. Re-inspect repaired areas, document recurring patterns, and turn leak detection into a maintenance routine instead of a one-off campaign. This workflow is deliberately practical. A plant does not need perfect certainty to start. It needs enough confidence that the waste is real, enough visibility to localize leaks efficiently, and enough follow-through to keep repairs from becoming a one-time campaign. FAQ How accurate is this compressed air leak cost calculator? It is a planning estimator, not an audit-grade model. Its job is to frame annual exposure quickly by using realistic operating assumptions and a user-defined leak-loss percentage. What leak-loss percentage should I start with? If you do not know your current leak level, 20% is a practical starting case. DOE and ENERGY STAR both identify that range as common enough to deserve attention, and you can compare it against lower and higher scenarios. Why not just estimate the savings and skip leak detection? Because the estimate does not tell you where the leaks are. Plants still need an inspection method that turns a cost problem into a repair list. When does acoustic imaging make the biggest difference? It is most useful when the leak is hard to localize quickly by ear or with manual point-by-point search, especially on overhead lines, dense manifolds, crowded mechanical spaces, and multiple-connection assemblies. Estimate the cost, locate the leaks, and turn the result into repairs. If your annual loss is already large enough to justify action, talk with CRYSOUND about acoustic leak detection solutions. Sources U.S. Department of Energy, Improve Compressed Air System Performance: A Sourcebook for Industry — https://www.energy.gov/eere/amo/improve-compressed-air-system-performance-sourcebook-industry ENERGY STAR, Compressed Air System Leaks — https://www.energystar.gov/industrial_plants/earn_recognition/small_manufacturing/guide/compressed_air_system_leaks U.S. Department of Energy, AIRMaster+ — https://www.energy.gov/eere/amo/articles/airmaster

An Open Platform For Intelligent Sound Imaging

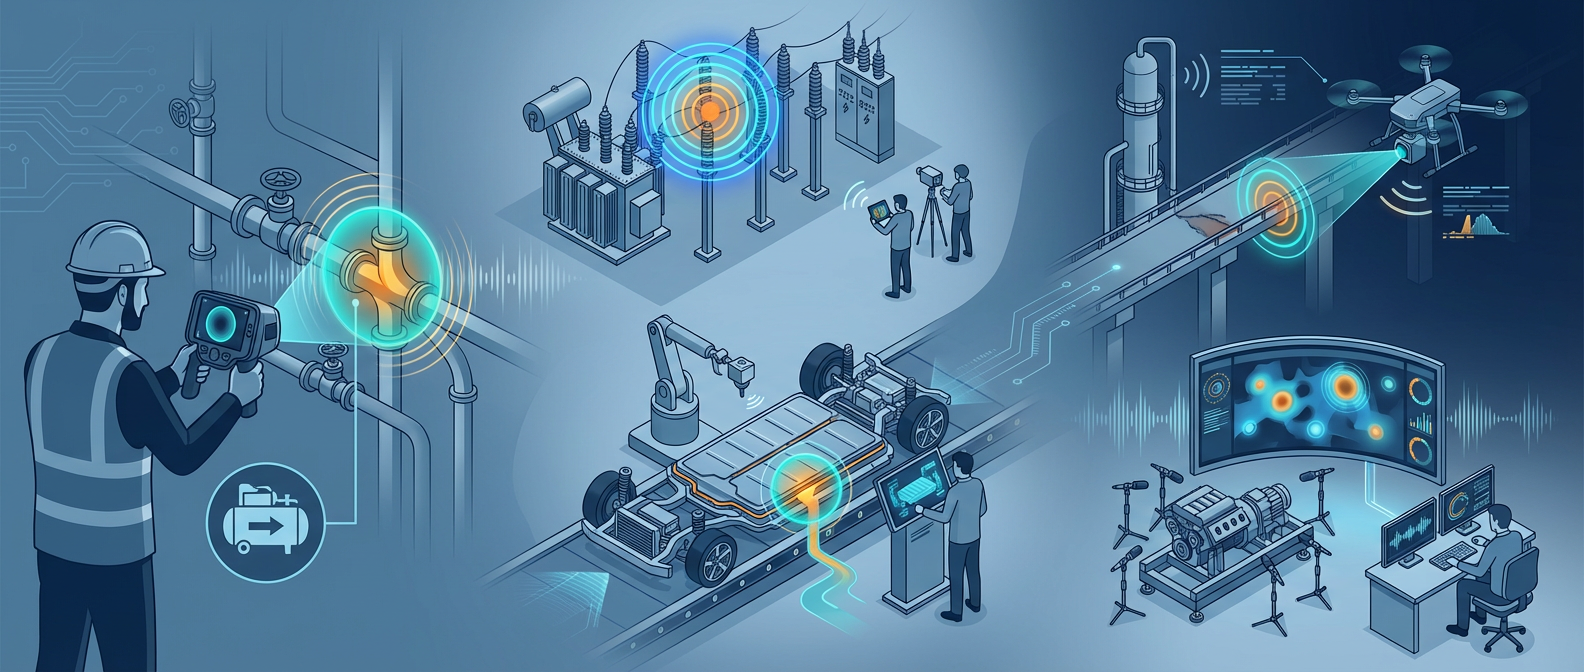
In the fields of acoustic research and industrial inspection, sound is no longer just a signal to be "heard",but information that can be "seen". How to visualize, analyze, and quantify sound has been a long-standing pursuit for research institutions and engineers alike. Today, leveraging its deep expertise in acoustics, CRYSOUND has launched the new SonoCam Pi product series—not just an acoustic camera, but an open acoustic platform, redefining the future of acoustic measurement and imaging. Making Acoustic Experiments Simpler And More Efficient In recent years, microphone arrays have been rapidly adopted in acoustic research. However, research institutions commonly face the following challenges: Traditional systems are expensive and offer a limited number of channels. Array design and algorithm development are complex and time-consuming. In-house array development lacks mature supply chains and integrated hardware-software support. To address these challenges, CRYSOUND leveraging nearly 30 years of expertise in acoustic testing and signal processing, has developed the SonoCam Pi platform—an affordable, open, and programmable acoustic solution. It enables researchers, engineers, and university students to enter the world of acoustic imaging and algorithm validation more quickly, flexibly, and cost-effectively. An Acoustic Development Platform For Research And Industry Hardware Highlights: Large Arrays & Multi-Geometry Adaptability 208-channel MEMS microphone array, supporting replacement and customization. Array diameters of 30 cm / 70 cm / 110 cm, enabling easy switching between near-field and far-field measurements. Wideband response from 20 Hz to 20 kHz, suitable for both precision lab testing and on-site measurements. Modular design, allowing rapid deployment and flexible expansion. SonoCam Pi product appearance Software Ecosystem: Open APIs & Algorithm Freedom Provides an API for 208-channel raw audio waveform data. Comes with a MATLAB acoustic imaging algorithm Demo App for rapid algorithm validation. Built-in acoustic imaging algorithms including Far-field Beamforming and Near-field Acoustic Holography. Supports secondary development, enabling users to build customized acoustic analysis tools. In short, SonoCam Pi is not just a hardware device—it is a complete platform for acoustic algorithm development and experimental validation. From Lab To Factory: Applications Of SonoCam Pi Acoustic Drone Detection Powered by array-based localization and identification algorithms, SonoCam Pi can accurately capture the acoustic signature of drones, enabling reliable low-altitude acoustic detection to support security monitoring and drone detection for site security. Drone detection Acoustic Research & Algorithm Development Research institutions can leverage SonoCam Pi's 208-channel raw-data API and MATLAB demo tools to rapidly validate research algorithms such as Far-field Beamforming and Near-field Acoustic Holography. Algorithm development Sound Propagation Path Analysis Supports directional analysis of both structure-borne and airborne sound propagation, helping researchers and engineers more intuitively understand the transmission mechanisms of noise sources. Sound propagation path analysis Automotive NVH Noise Inspection By combining beamforming and acoustic holography techniques, SonoCam Pi can quickly pinpoint interior and exterior noise sources, visualize acoustic radiation, and support NVH optimization as well as overall vehicle sound quality improvement. NVH research Open · Efficient · Intelligent: A New Start For Acoustic Research Whether for algorithm validation in university laboratories or noise diagnostics in industrial environments, SonoCam Pi has become a new-generation acoustic tool for both research and engineering practice, thanks to its outstanding performance, comprehensive ecosystem, and high level of openness. It makes acoustic measurement more portable, more intelligent, and more open—not only enabling users to see sound, but also empowering researchers to reshape the way sound is understood. SonoCam Pi is more than an acoustic camera; it is an acoustic application ecosystem platform. As technology and acoustic algorithms continue to evolve, CRYSOUND will keep advancing SonoCam Pi, enabling acoustic imaging to unlock new potential across more fields and working hand in hand with research and industrial users to explore the limitless possibilities of the acoustic world. If you'd like to learn more about the applications of CRYSOUND's SonoCam Pi, or discuss the most suitable solution for your needs, please contact us via the form below. Our sales or technical support engineers will get in touch with you shortly.
Support Support
Product Catalogs Product Catalogs Solutions Solutions User Manuals User Manuals Software Download Software Download Product Inquiry Product Inquiry Schedule Demo Schedule Demo Technical Support Technical Support +86-571-88225128 +86-571-88225128
Request Quote 0
Request Quote