


How long does sound linger in a room after the source stops? Reverberation time describes this decay and helps engineers understand the acoustic characteristics of a test space. Using OpenTest's RT60 function, this article covers channel setup, evaluation ranges, background-noise measurement, and the measurement workflow, then explains how to review decay curves and frequency-band results.
Room Acoustics: Why Sound Lingers After the Source Stops
Speak in an empty room, and the end of a sentence may linger. In a room with carpets and furniture, the same sound often fades more quickly. After the source stops, sound continues to reflect between the walls, floor, and ceiling, gradually weakening as energy is absorbed. This is reverberation.
For R&D and acoustic engineers, the room is more than a passive backdrop. The same loudspeaker or sound source can behave differently in different spaces. Understanding how the environment affects sound decay helps distinguish the product's own acoustic behavior from the influence of the test space.
A sound level in decibels does not describe this difference on its own. We also need to ask: how quickly does the level fall after the source stops?
Reverberation Time: Understanding the Rate of Decay
RT60 commonly refers to the time, in seconds, corresponding to a 60 dB decrease in the room's sound level after the source stops. It describes the rate of decay, not how loud the source is while it is operating.
In practice, a room does not always provide a complete, clearly measurable 60 dB decay. Air conditioning, outdoor traffic, and the measurement system's own noise can obscure the decay tail. Measurements therefore often estimate the decay slope over a shorter usable range and extrapolate it to 60 dB. T20 and T30 are common examples of this approach.
A shorter RT60 is not necessarily better. Meeting rooms, music spaces, and product acoustic validation environments have different requirements. Reverberation time describes an important characteristic of a space, but it does not replace assessments of speech clarity, sound insulation, or product sound quality.
Measurement Setup: Establishing Comparable Conditions
The workflow in this article plays a test sound, stops the source, and records the resulting decay. A typical setup consists of a test sound source, a measurement microphone, a data acquisition device, and a computer running OpenTest.
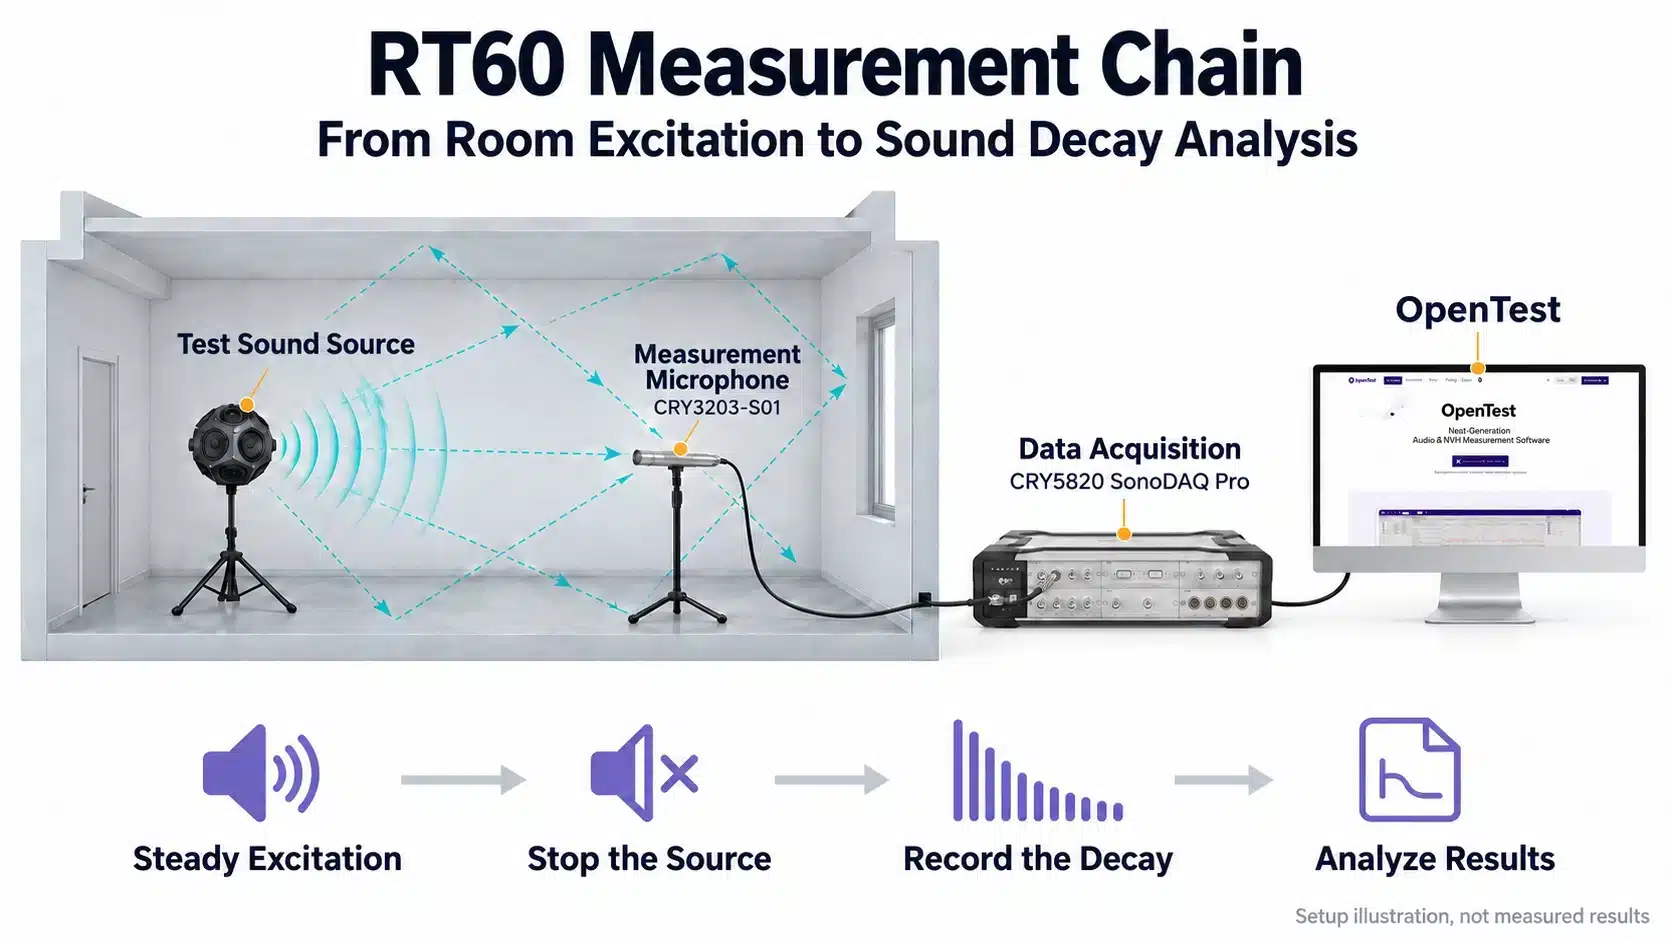
Figure 1. RT60 measurement chain: the source excites the room, while the microphone and DAQ device record the sound decay.
In OpenTest, select the input channel connected to the microphone and check its sensitivity, calibration information, and input range. Correct channel settings are essential for interpreting sound pressure and background noise. The input range must accommodate both the higher level during excitation and the low-level signal during decay without overloading.
Record the source and microphone positions, along with the state of doors, windows, air conditioning, furniture, and room occupancy. Keep these conditions as consistent as possible when comparing measurements. Otherwise, a change in the results may reflect a change in measurement conditions rather than the effect of acoustic treatment.
The source must cover the target frequency range and provide sufficient excitation. A high overall sound level does not guarantee adequate excitation in every band. Source selection, measurement positions, and the number of measurements should follow the method adopted for the project.
Parameter Setup: Selecting Frequency Bands and Evaluation Ranges
In OpenTest's RT60 function, configure the input channels, measurement controls, analysis settings, and basic room information. After changing parameters, use the updated settings for the next measurement.
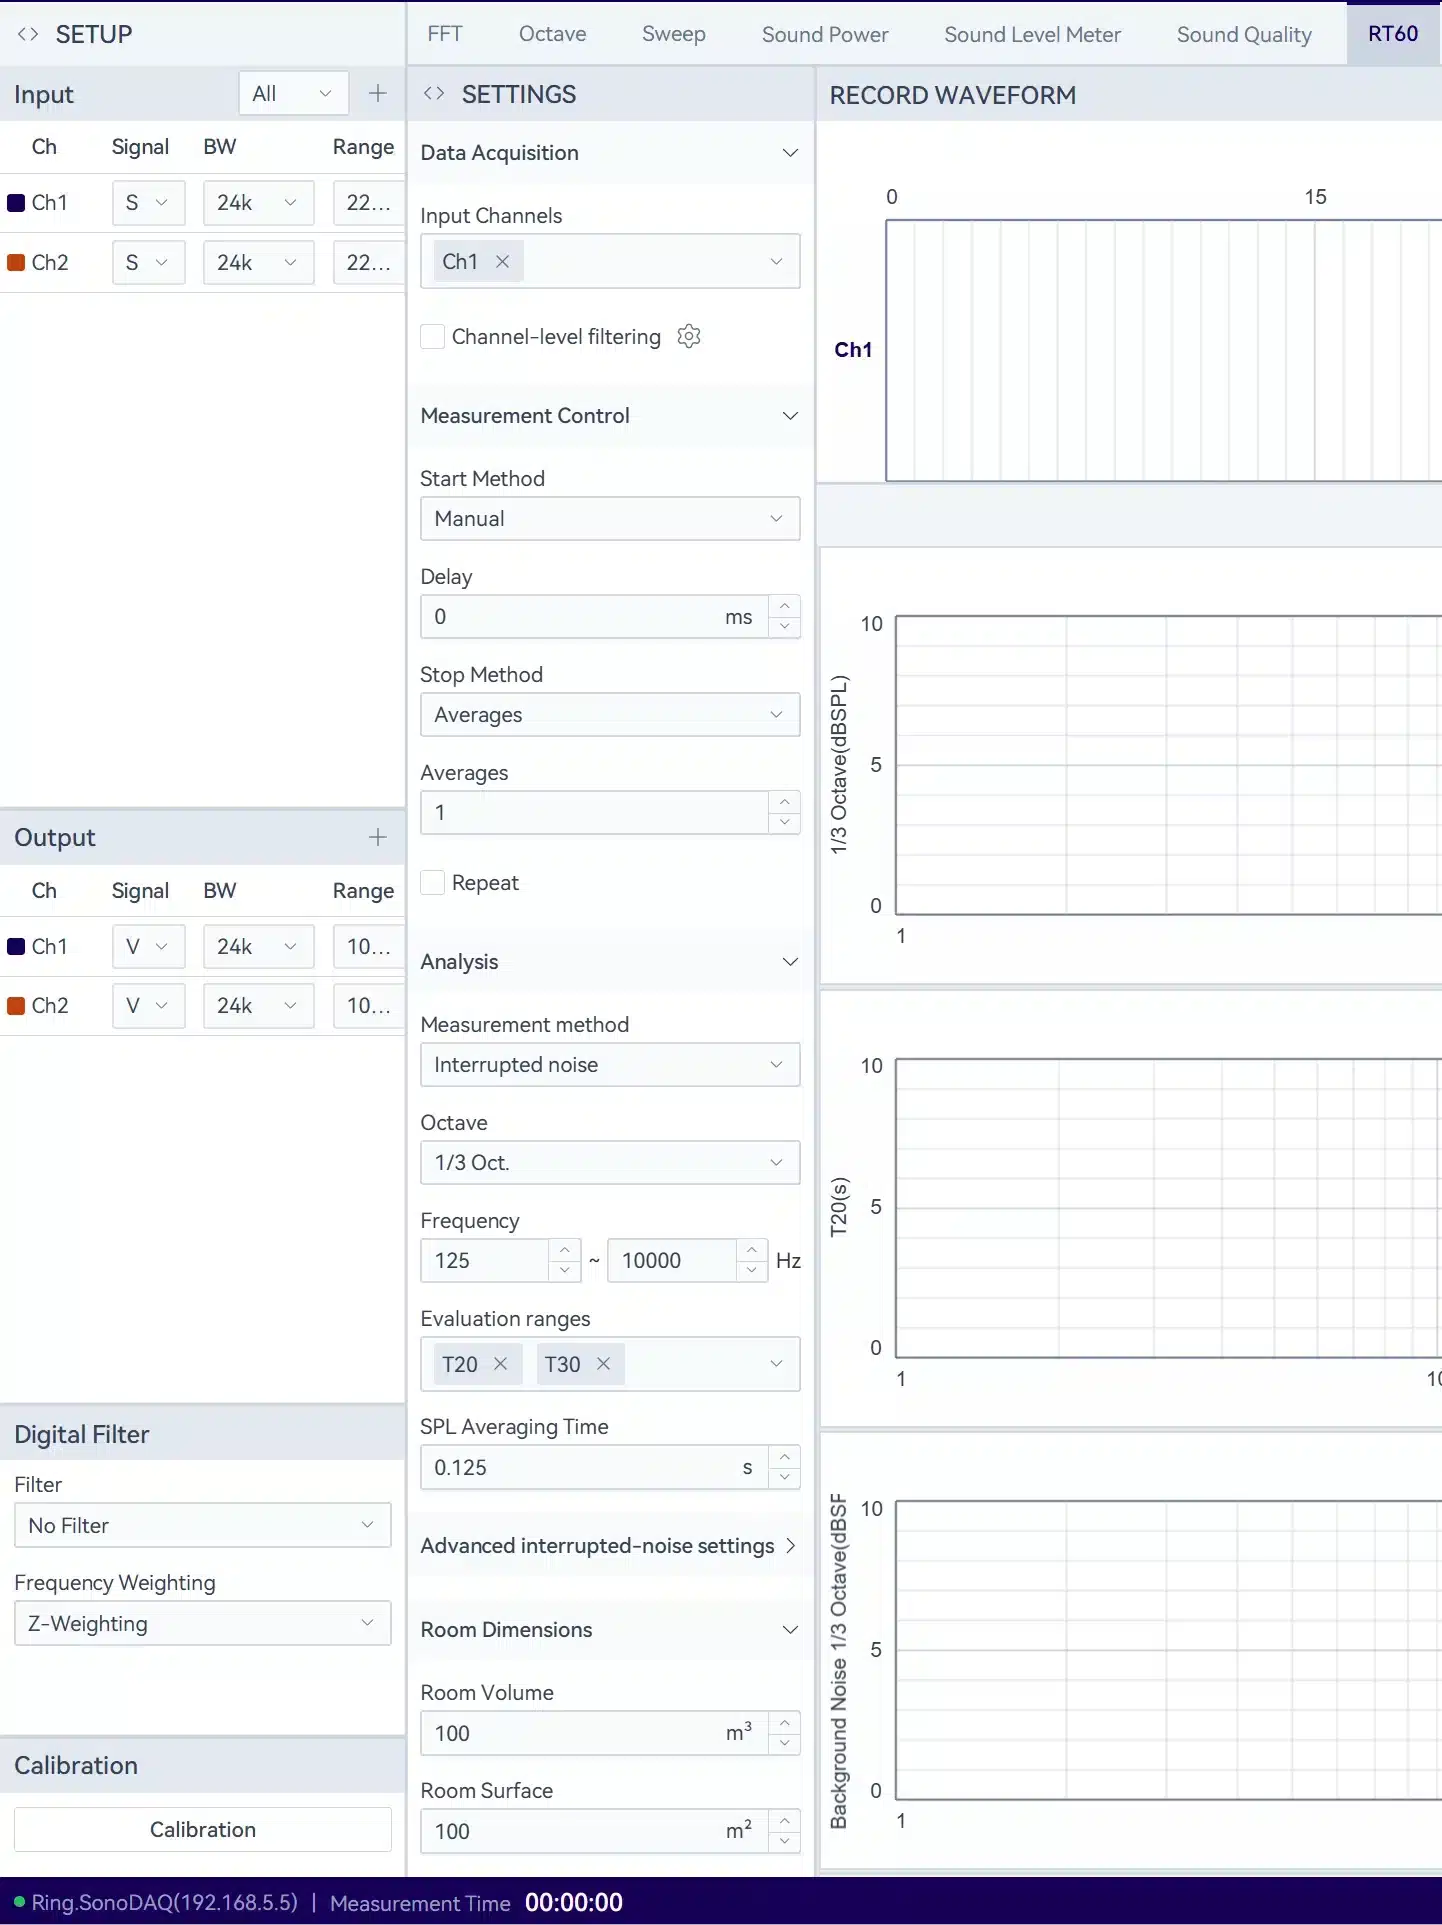
Figure 2. OpenTest RT60 configuration: setting input channels and analysis parameters.
Frequency-band settings define what you analyze, not just what the chart displays. A room does not absorb sound or allow it to decay equally at every frequency. A single overall value may hide slower decay at low frequencies and faster decay elsewhere. Before comparing measurements, confirm that they use the same analysis bands and frequency range.
The evaluation range determines which part of the decay is used to estimate the result. Common T20 and T30 fitting ranges are shown below. All levels are relative to the reference level before the decay:
| Evaluation | Fitting Range | Decay Span Used |
| T20 | -5 dB to -25 dB | 20 dB |
| T30 | -5 dB to -35 dB | 30 dB |
The numbers 20 and 30 describe the span of the evaluation range. They do not mean that the final result represents only a 20 dB or 30 dB decay. Under the usual acoustic definitions, both T20 and T30 are estimates of the reverberation time corresponding to a 60 dB decay.
Consider an illustrative calculation: if a fitted line falls from -5 dB to -25 dB in 0.40 s, extrapolating the same slope gives approximately 1.20 s for a 60 dB decay. This is an example, not a measured result. A reverberation time that has already been extrapolated must not be multiplied by three again.
Selecting T30 does not automatically produce a better result. It requires a longer usable decay range. If background noise affects the later part of the decay, improve the measurement conditions first, or use T20 where the measurement requirements permit.
Background Noise: Checking the Usable Decay Range
Background noise limits how far the decay can be followed reliably. As the curve approaches the noise floor, the remaining variation may no longer represent the room's reverberation alone.
OpenTest supports measuring background noise first. Once the signal is stable, the software automatically ends this stage and calculates a target sound pressure level based on the measurement objective, providing a reference for setting the source.
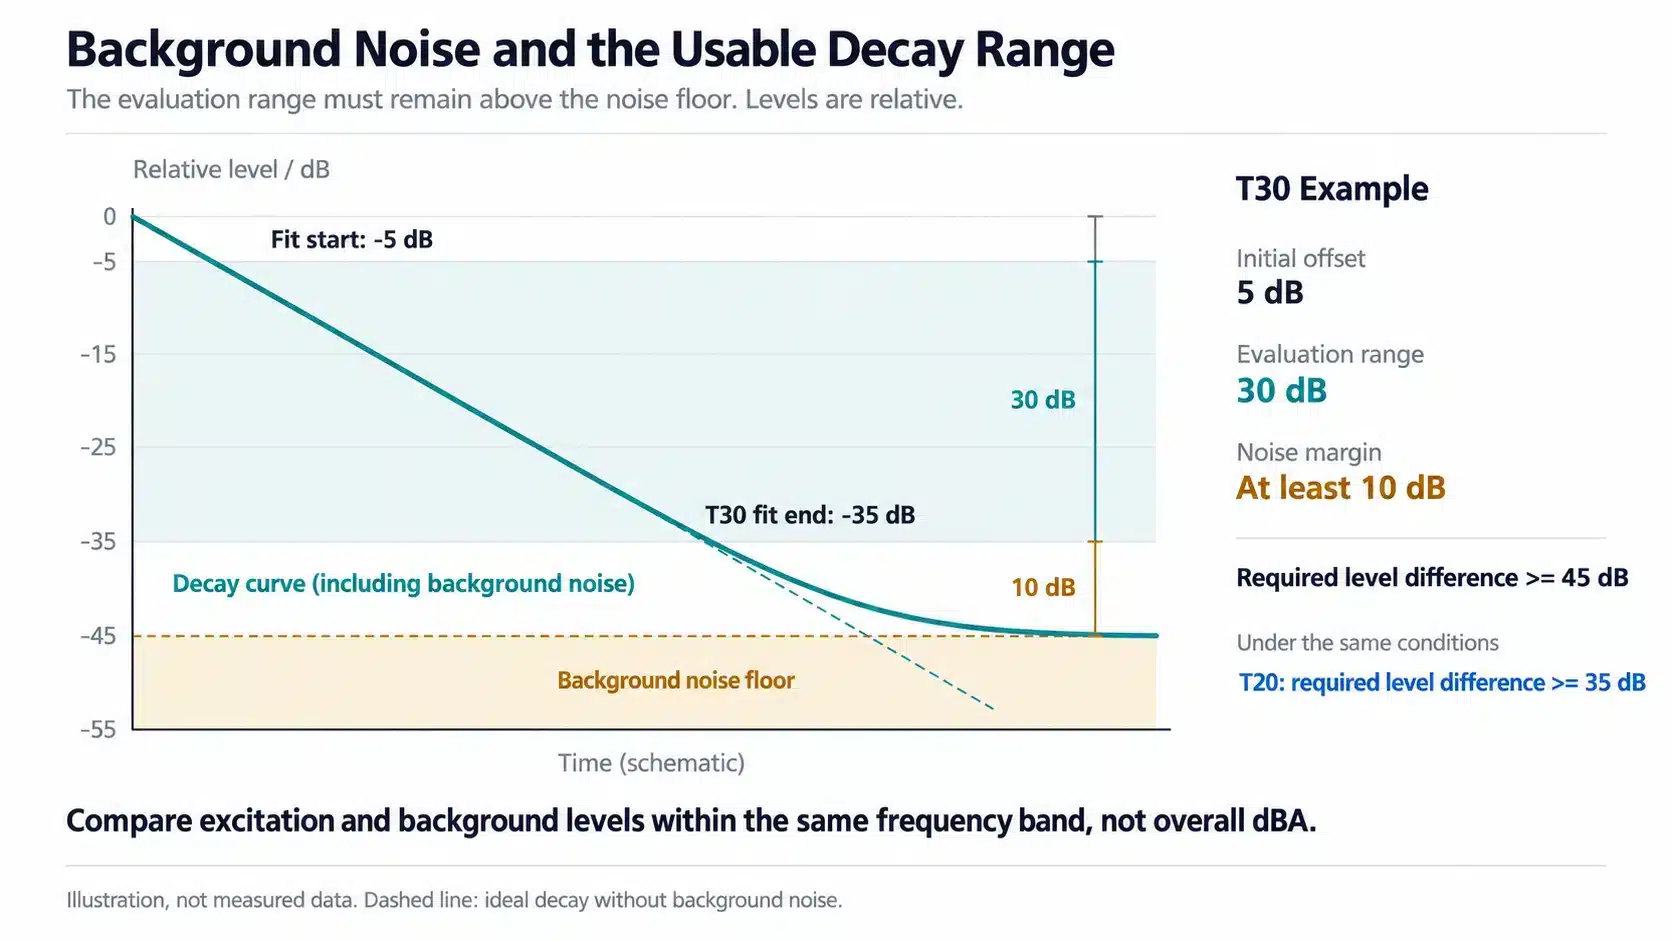
Figure 3. Background noise and the usable decay range: the noise floor limits the range available for fitting. Illustration, not measured data.
A simple relationship explains the dynamic-range requirement. If fitting begins 5 dB below the reference level and ends at least 10 dB above the background noise, T20 requires a level difference of approximately 35 dB, while T30 requires approximately 45 dB. This comparison is between the excitation level and background noise within the same frequency band. An overall A-weighted level cannot replace a band-by-band check.
If the margin is insufficient in a particular band, check the background noise, the source output in that band, and the acquisition chain. Simply increasing the volume can introduce source distortion, overload the input, or expose people to excessive noise. It is not a substitute for checking the complete measurement setup.
A background-noise measurement does not remain valid indefinitely. Recheck it when air-conditioning operation, outdoor noise, or activity in the room changes.
Measurement Workflow: From Steady Excitation to Sound Decay
Once the parameters and target sound pressure level have been set, proceed as follows:
- Start acquisition in OpenTest to record the full process.
- Turn on the test source and wait until the sound level reaches the target and stabilizes.
- Stop the source. Avoid talking, walking, or moving equipment.
- Let OpenTest calculate the decay data after the source stops.
- Review the record, then repeat the measurement or move to the next position as planned.
During measurement, ensure stable excitation conditions before stopping the sound source, and continue acquisition afterward to record the sound decay in the room. Do not gradually reduce the playback level instead of stopping the source, as changes in source output can affect the decay curve.
OpenTest supports averaging across repeated measurements and multiple measurement positions, but these serve different purposes. Repeating a measurement at one position helps assess repeatability. Changing positions reveals spatial variation. More repetitions cannot replace an appropriate measurement layout.
Result Interpretation: Reading the Curves and Frequency Bands
Once the results are available, resist the temptation to focus only on which value is lower. Review the decay, the frequency-band results, and the repeated measurements in that order.
First, check whether the decay supports the estimate. The evaluation range should cover a valid portion of the decay, not an unstable source level, a sudden disturbance, or a tail already close to the background noise. If the curve has distinct changes in slope, a single reverberation-time value may not adequately describe the whole decay.
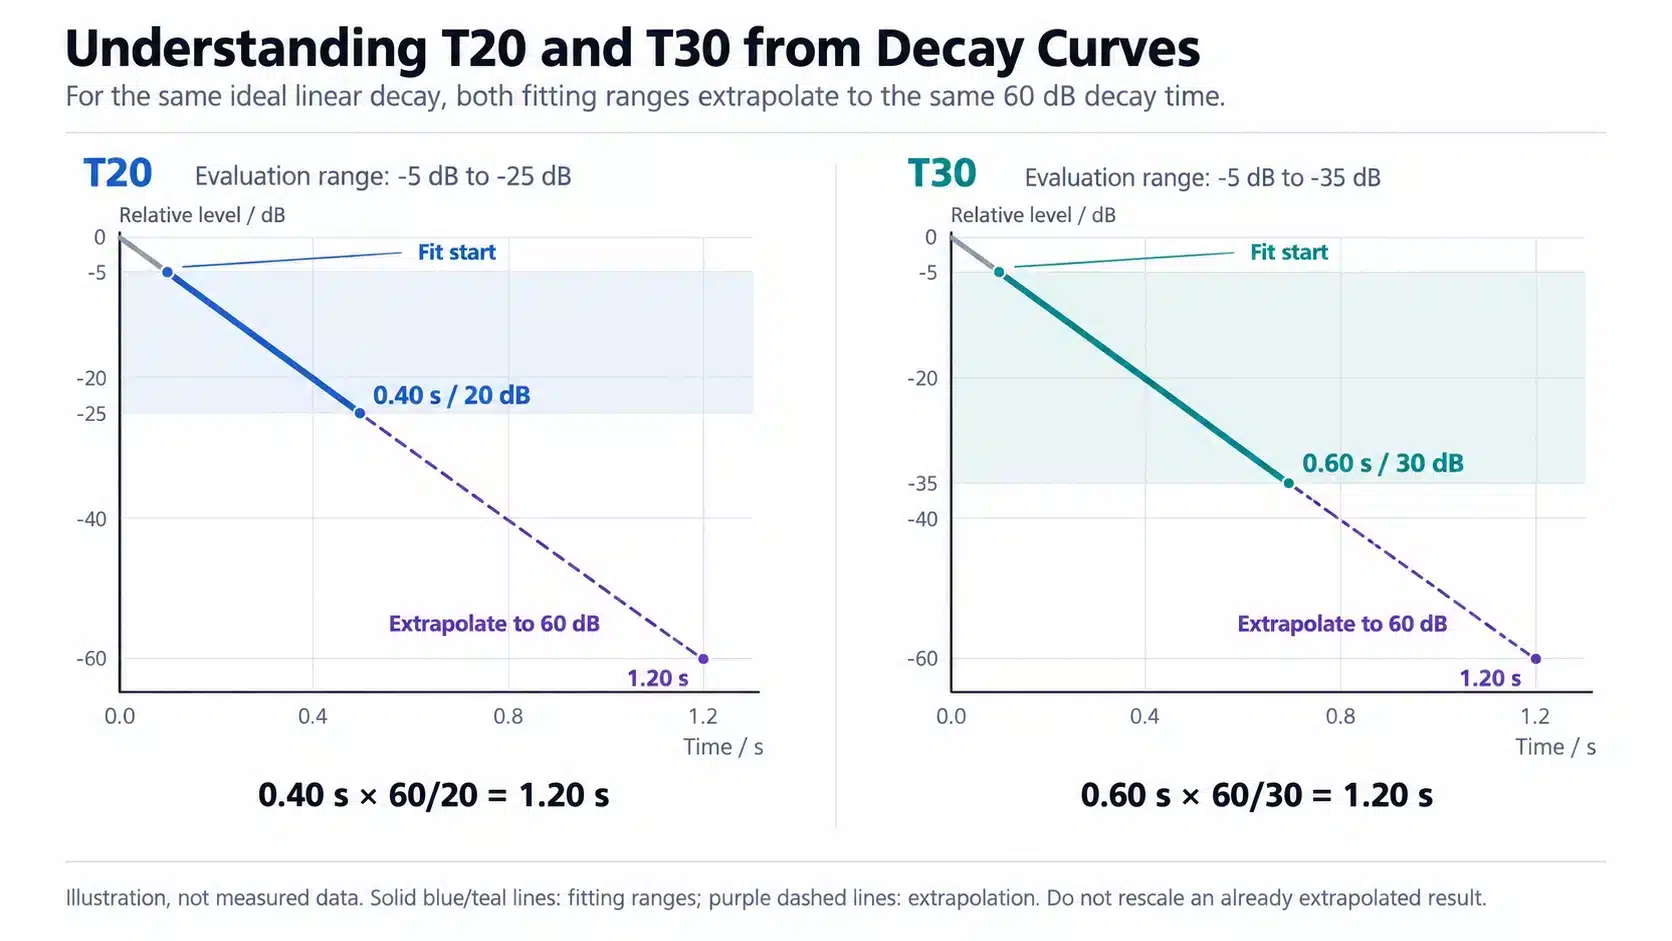
Figure 4. Understanding T20 and T30 from decay curves: evaluation ranges, fitted slopes, and extrapolation to 60 dB. Illustration, not measured data.
Next, identify the frequency bands where the differences occur. A substantially longer low-frequency reverberation time indicates slower decay of low-frequency energy. It does not, by itself, identify a particular wall or material as the cause. Interpret the results alongside the room layout and measurement positions. When comparing conditions before and after acoustic treatment, examine individual bands rather than only an average value.
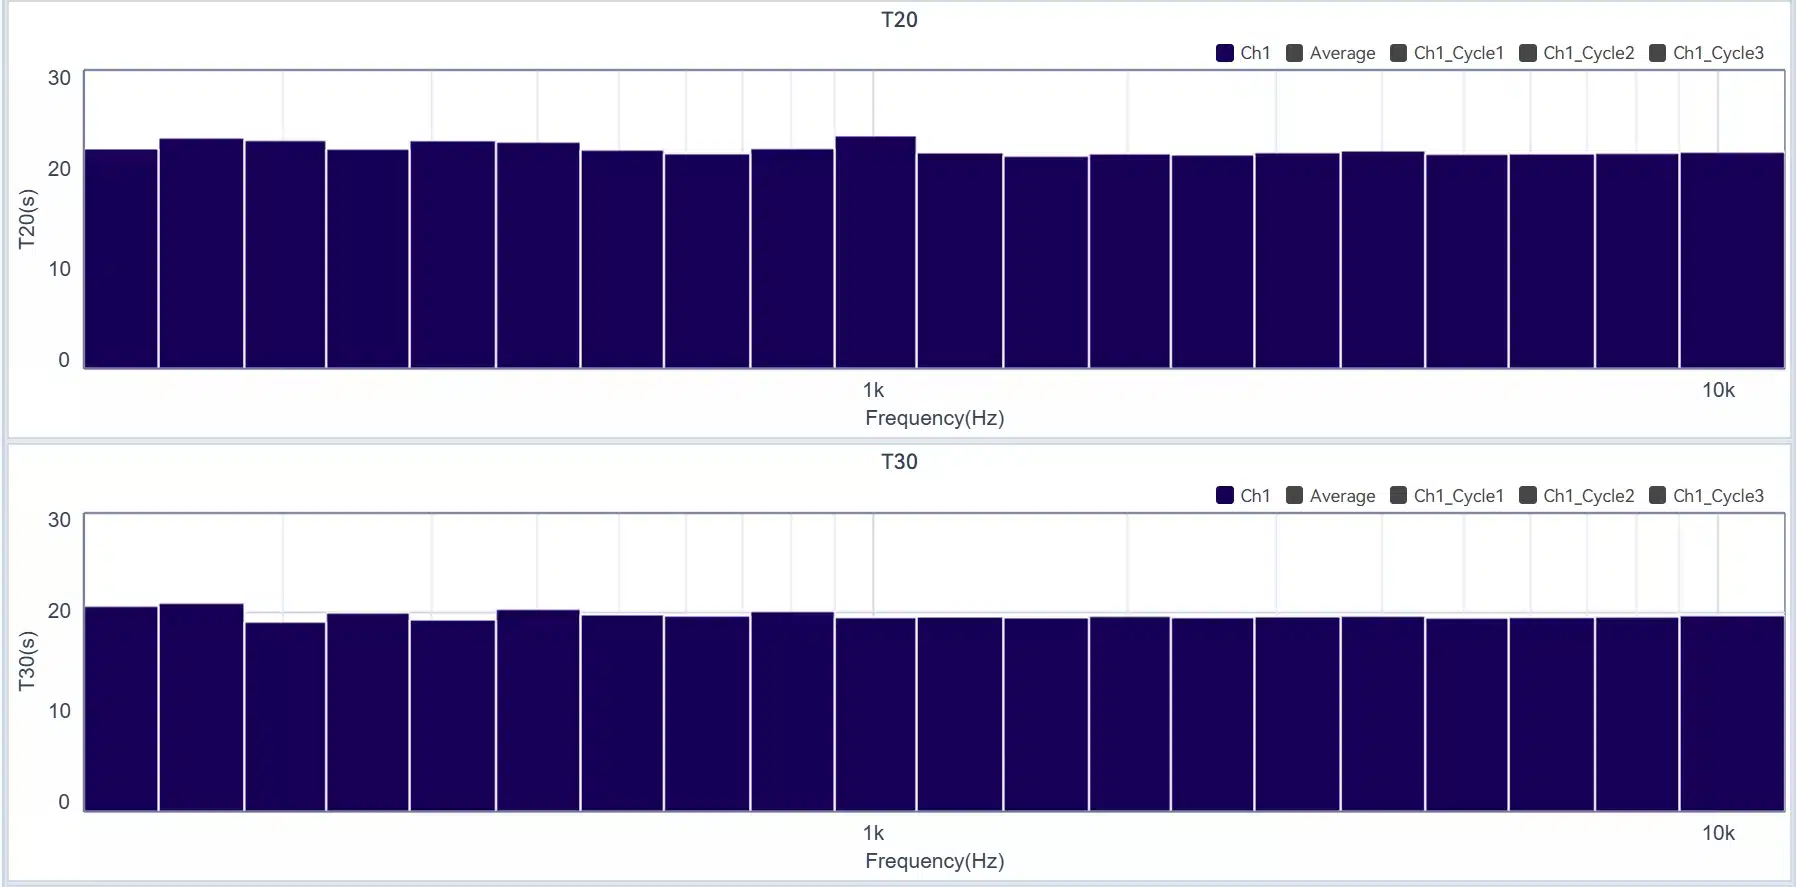
Figure 5. Frequency-band reverberation-time results in OpenTest: comparing decay characteristics across bands.
Finally, review repeatability and spatial variation. If results vary substantially at the same position, check source stability, background interference, and the measurement procedure. Differences between positions may reflect genuine spatial characteristics. Retain the individual records rather than reducing all observations to a single average.
If T20 and T30 differ, do not simply select the smaller value. They use different fitting ranges, and the difference may arise from the shape of the decay itself or from noise affecting its later portion. Reviewing the original record is more useful than comparing values without considering their measurement conditions.
Record Keeping: Making Results Reviewable
OpenTest retains measurement data so users can select previous records for playback and export waveforms or analysis data. Its reporting function can organize project information, device information, tables, and charts around the selected records.
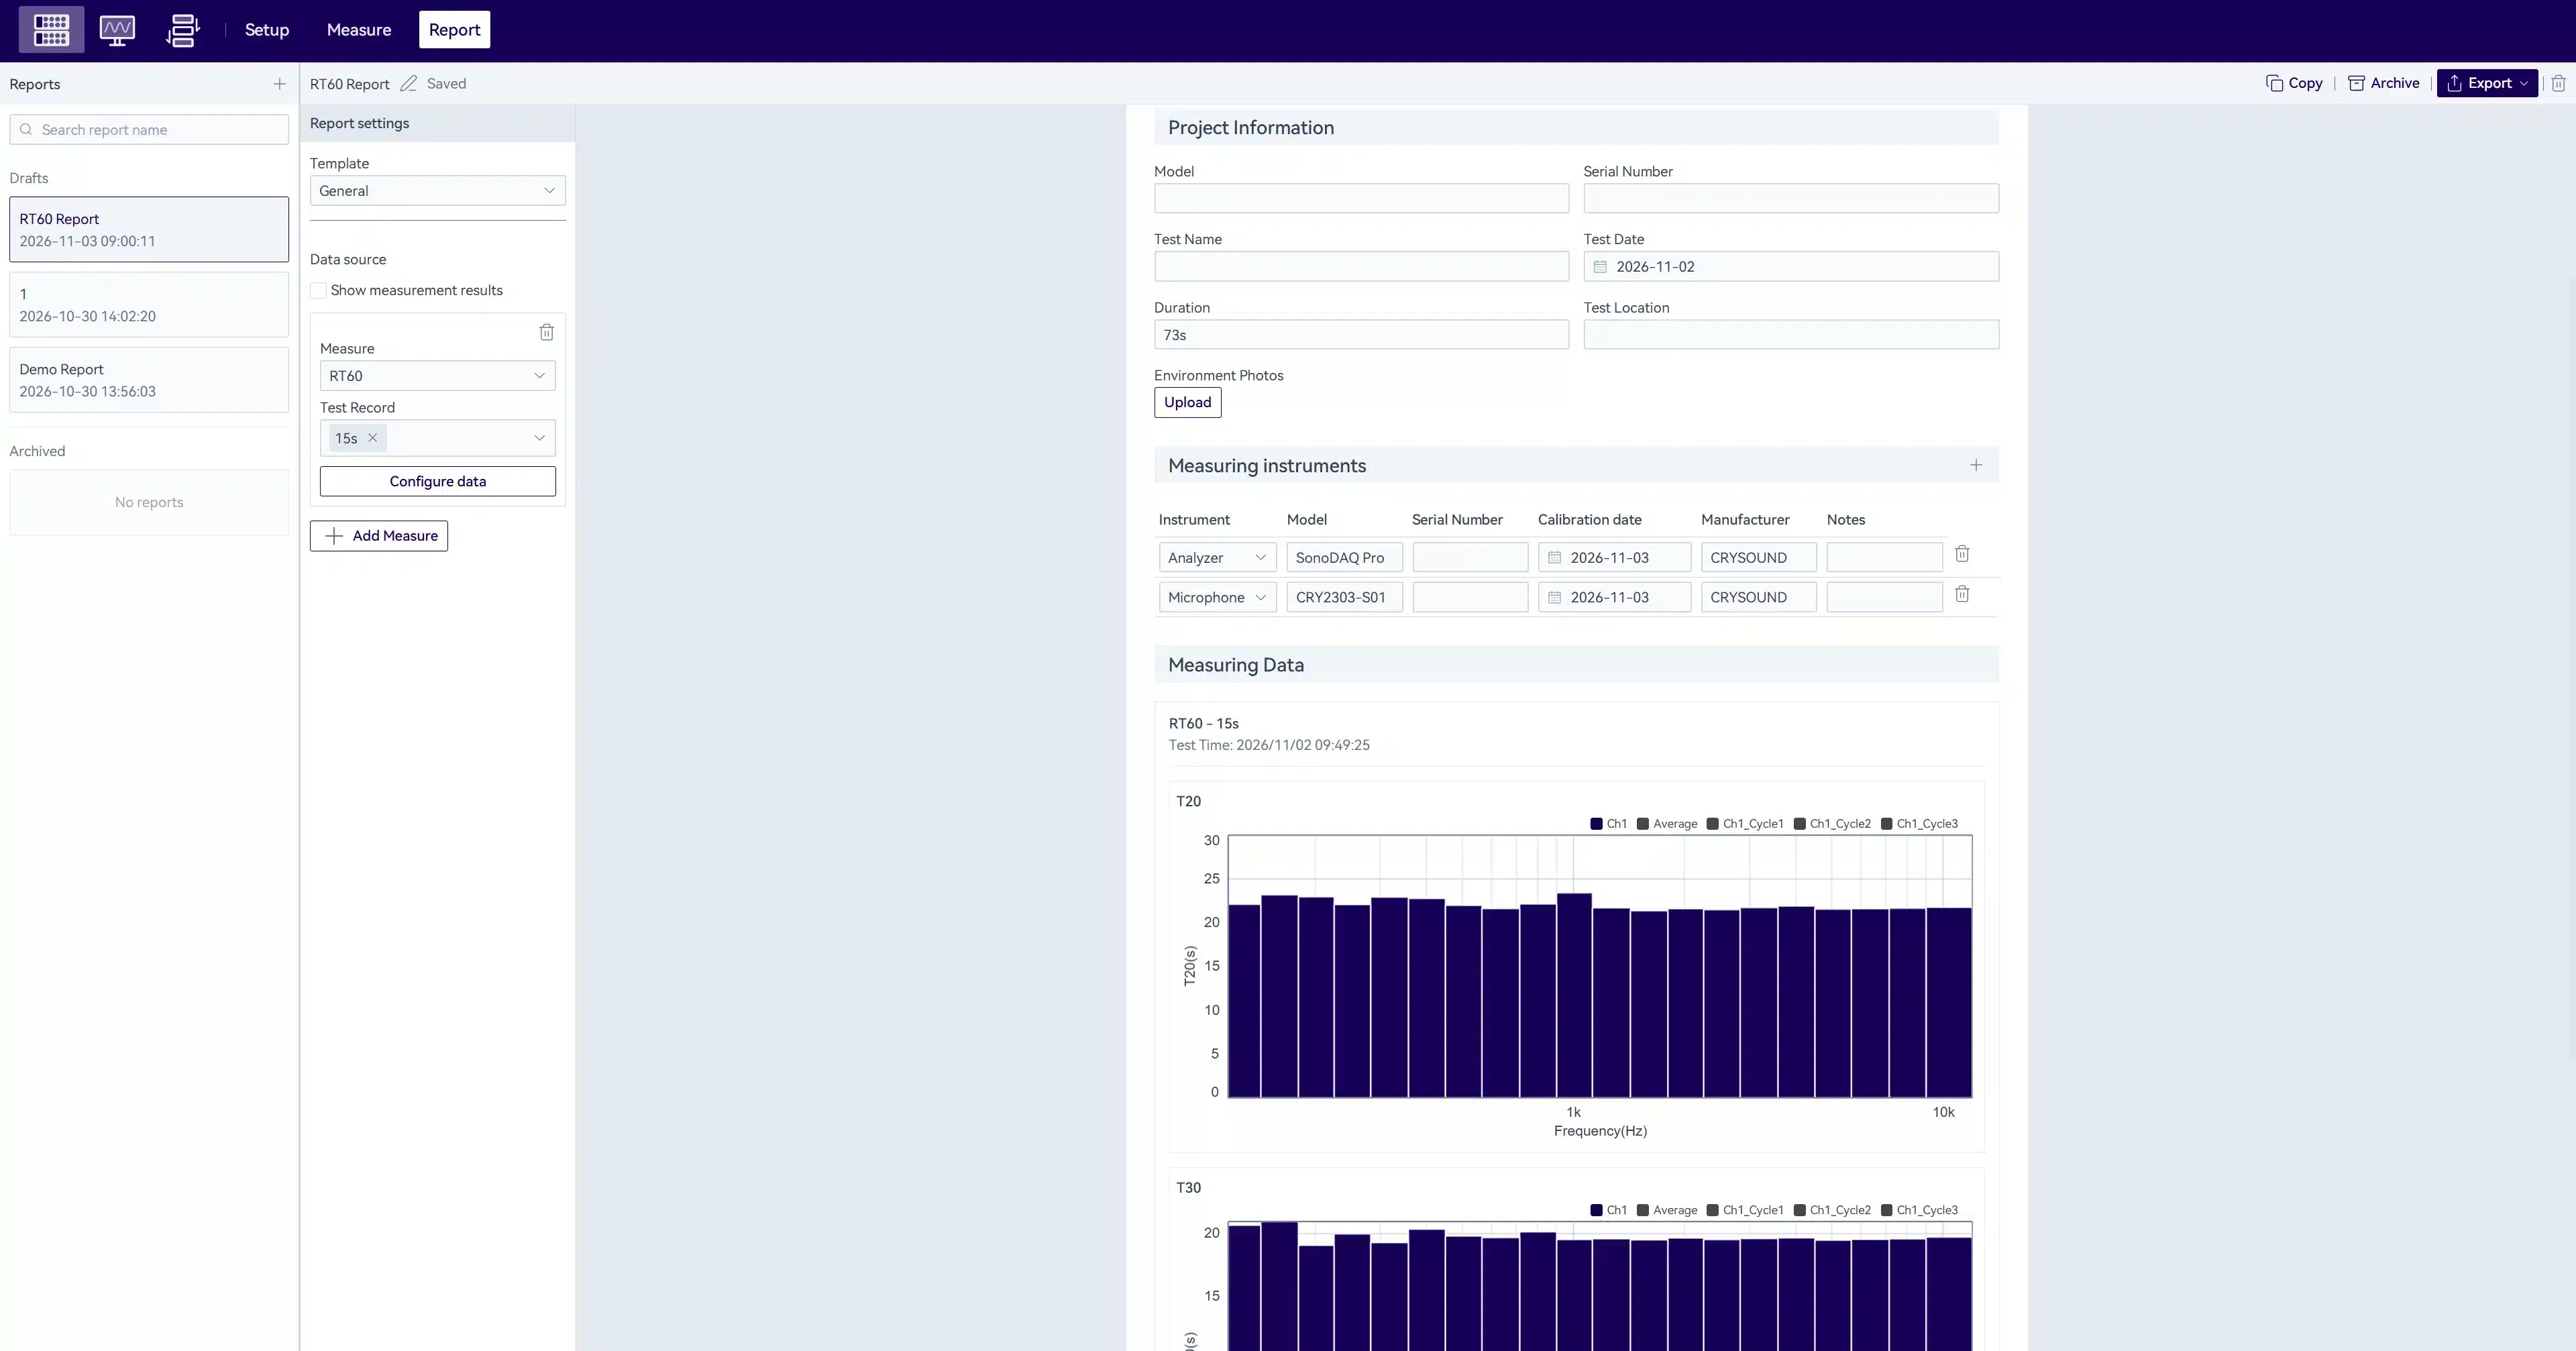
Figure 6. Measurement records and result review in OpenTest: retaining test data and analysis results.
For before-and-after comparisons, also retain the channel and calibration settings, source and microphone positions, background-noise data, analysis bands, evaluation method, and room conditions. These details document how the results were obtained and support repeat measurements and technical discussions.
Conclusion
Reverberation-time measurement is about more than obtaining a value in seconds. It should also establish which frequency band is decaying, which portion of the data supports the estimate, and whether different records are comparable.
With OpenTest's RT60 function, engineers can configure the measurement, acquire background noise, calculate decay results, and review the data. This turns a room's lingering sound into results that can be analyzed and compared. Understanding the purpose of each setting helps engineers judge whether the measurement conditions are adequate and use the results to support room-acoustic assessment.
To learn more, upgrade your plan, or further explore OpenTest, please fill out the Get in Touch form below.


