CRYSOUND POCKET Acoustic Imaging Camera Now Available on Kickstarter.

OpenTest releases a new version every month, with the goal of ensuring that each update introduces features that truly matter to users while making the software better and faster with every release. OpenTest v1.4.0 Beta is now available, bringing updates across signal generation, hardware compatibility, new algorithms, feature improvements, and a simpler licensing experience:
- Expanded Generator support for multi-tone, dual-tone, and waveform files
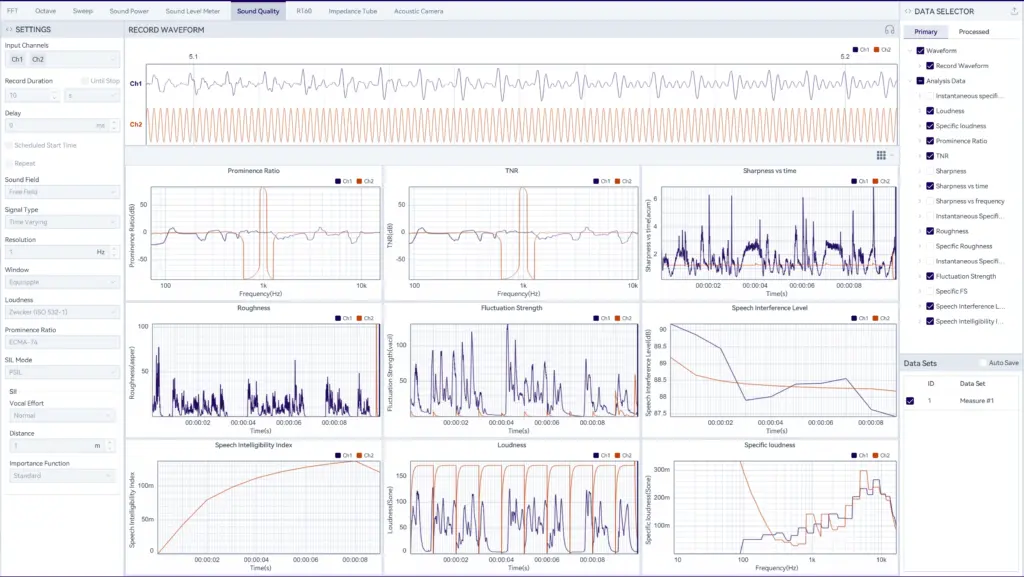
- Expanded Sound Quality measurements with roughness, fluctuation strength, speech interference level, and speech intelligibility index
- In the Sound Power module, the parallelepiped measurement surface now supports dynamic calculation of microphone positions based on the DUT and measurement distance
- Dynamic monitoring of remaining storage capacity during testing, with automatic stop when available space is less than 1 GB to prevent data loss
- Added support for the SonoDAQ ADS module
- Added Spanish language support
- Fully upgraded licensing system, with direct online purchase and upgrade available on the OpenTest website
Why This Update Matters
In acoustic and NVH testing, improving efficiency is not only about adding more algorithms. It is also about reducing the small points of friction that slow engineers down, such as limited Generator capability, data loss caused by insufficient storage, cumbersome standard-based calculations, and inconvenient license updates.
OpenTest 1.4.0 Beta is designed to address exactly these issues.
More Flexible Signal Generation for Real Test Conditions
The upgraded OpenTest Generator now supports:
- Sine waves (single-tone, dual-tone, and multi-tone)
- Square waves
- Noise (white noise and pink noise)
- Waveform file import
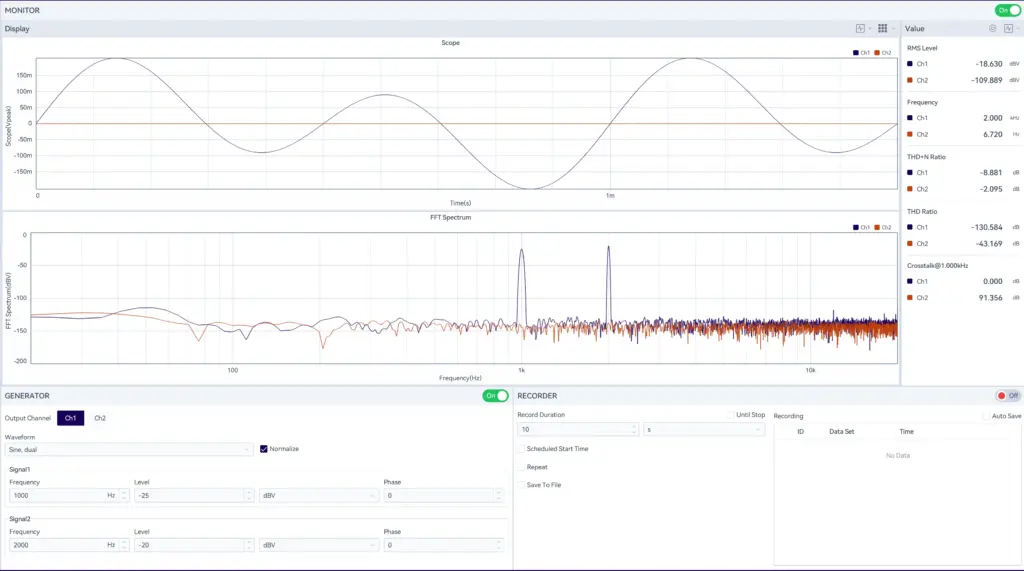
This means users are no longer limited to simple excitation. Instead, they can build test conditions that more closely reflect actual product behavior, production verification logic, or customer-specific excitation requirements.
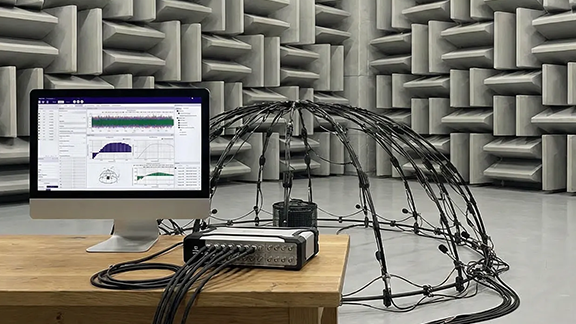
This is especially useful for scenarios where only the Monitor & Generator functions are used for real-time analysis. In such cases, the team no longer needs an external signal generator. With only one DAQ device that supports both input and output channels, such as the CRY5820 SonoDAQ Pro, the required measurement can be completed.
More Complete Sound Quality Analysis
In more and more applications, "how it sounds" matters just as much as "how loud it is." For many products, two samples may have similar SPL values, yet their perceived sound quality can be completely different.
After this upgrade, the OpenTest Sound Quality module supports simultaneous analysis of Loudness, Sharpness, Roughness, Fluctuation Strength, PR, TNR, SIL, and SII.
These expanded sound quality analysis capabilities make the workflow more complete for engineers. They can be used to evaluate annoyance, comfort, modulation behavior, and speech-related acoustic performance. The updated module is suitable for scenarios such as automotive NVH and in-cabin sound evaluation, home appliance and HVAC noise optimization, and other applications where subjective listening impressions need to be translated into quantitative engineering metrics.
For more information, continue reading: Sound Quality Measurement: ISO 532 Loudness & ECMA-74 Tonality Guide (Free OpenTest)
Faster Sound Power Microphone Layout Configuration
Sound power testing requires microphone positions to be calculated according to the standard. Different measurement surfaces, DUT sizes, and measurement distances result in different microphone layouts.
In v1.4.0 Beta, the parallelepiped measurement surface now supports dynamic calculation of microphone positions based on DUT dimensions and the selected measurement distance.
This improvement reduces manual calculation and setup work, helping users configure sound power tests more efficiently and consistently.
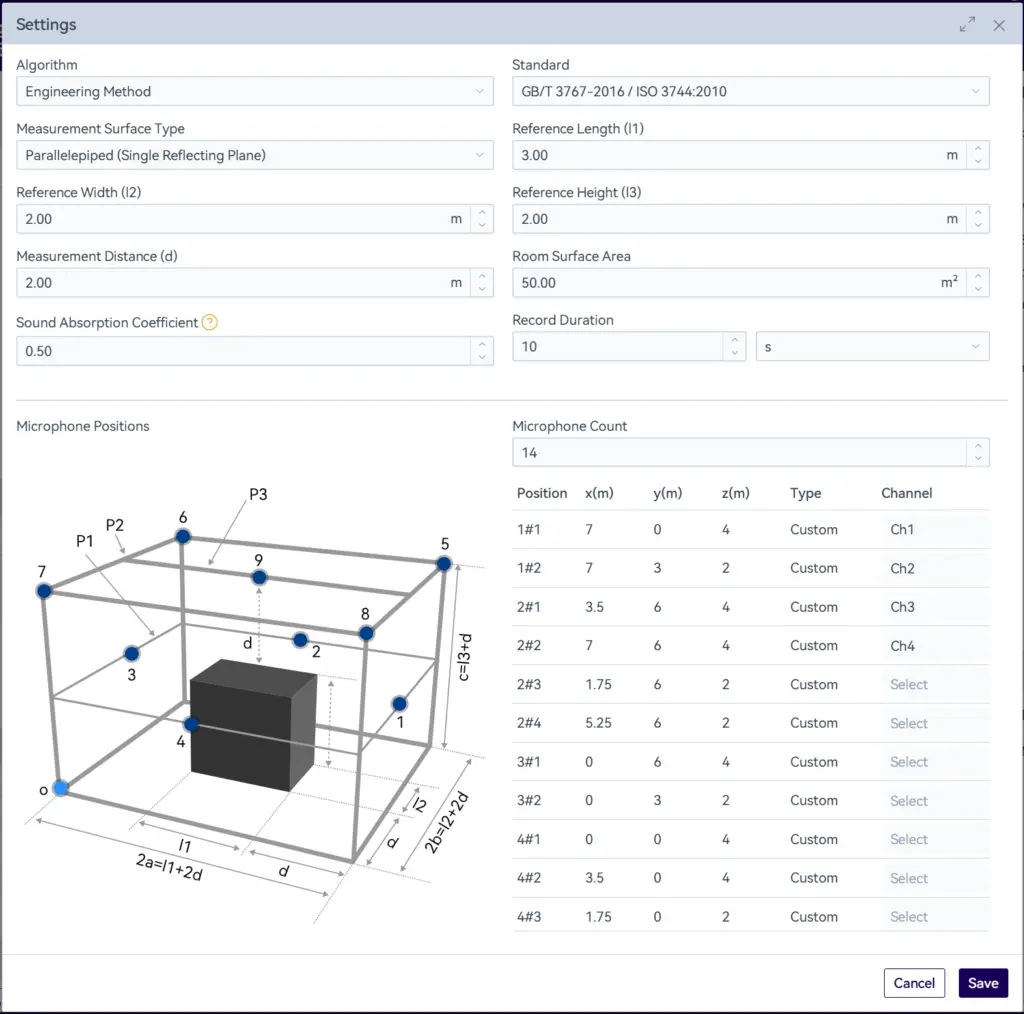
For laboratories that need to handle multiple DUT sizes or frequently switch test objects, this means less time spent on calculation and setup, and more time focused on the measurement itself.
For more information, continue reading: ISO 3744 Sound Power Testing with OpenTest
Safer Long-Duration Measurements with Dynamic Storage Protection
Long-duration measurements are common in noise monitoring, durability studies, unattended operation, and field testing. However, they also come with a practical risk: running out of storage during acquisition.
In v1.4.0 Beta, OpenTest dynamically monitors the remaining storage capacity during testing. When available space falls below 1 GB, recording stops automatically to prevent data loss and workflow interruption.
This may seem like a small change, but it brings significant practical value. In the past, engineers often discovered storage failure only after a long test had already ended. Now, OpenTest provides built-in protection during acquisition itself.
For teams that rely on overnight recording or scheduled long-duration measurements, this makes OpenTest much more dependable in real-world testing environments.
Adapted for the SonoDAQ ADS Module
OpenTest is now fully adapted to the SonoDAQ platform and currently supports the IED, IES, ADD, and ADS modules, delivering a high-quality user experience across the SonoDAQ ecosystem.
As the SonoDAQ module family continues to expand, OpenTest will continue to add support for new modules, further extending platform compatibility within the CRYSOUND hardware ecosystem.
Added Spanish Language Support
As the platform continues to expand internationally, language accessibility matters not only for ease of use, but also for training, deployment, and adoption across distributed teams.
The addition of Spanish is another step toward making OpenTest more practical for global users and partners.
OpenTest now supports 8 languages:
- Chinese
- English
- Russian
- German
- French
- Japanese
- Korean
- Spanish
A Simpler Licensing Experience with Online Trial, Upgrade, and Add-On Options
This release also includes a comprehensive upgrade to the OpenTest licensing system.
Users can now directly download the free version for evaluation and complete online upgrades and purchases through the OpenTest website, significantly simplifying the trial and upgrade process.
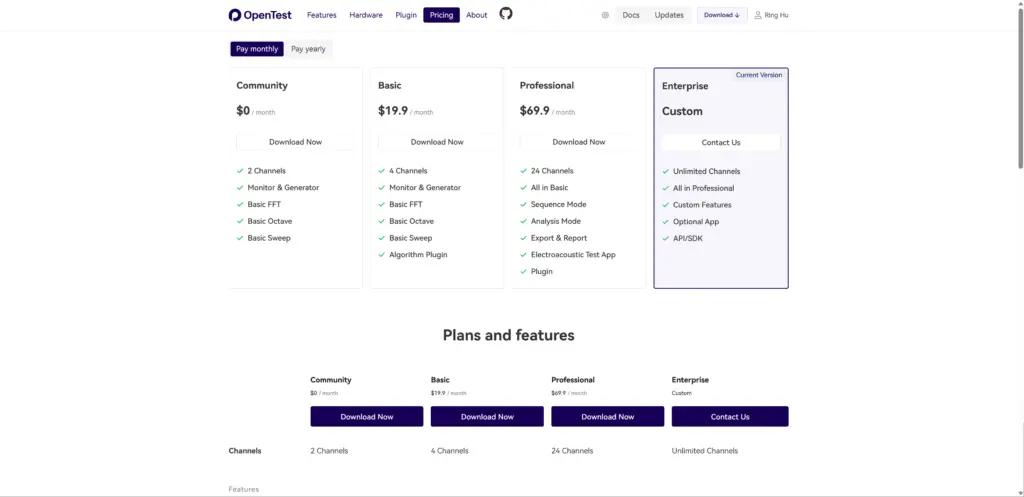
The Community Edition serves as a free entry point, enabling users to get started with a low barrier and validate the platform's core value. The Basic and Professional Editions are offered on an annual subscription basis, designed for individual engineers and small teams that require more channels, advanced functionality, and ongoing support. The Enterprise Edition is intended for more complex needs such as white labeling, custom features, organization-wide expansion, and dedicated support. For functional add-ons such as the Sound Power add-on and the Sound Quality add-on, users can also purchase incrementally based on actual needs.
This means the value of the licensing upgrade goes beyond simply making purchasing more convenient. More importantly, it enables users to move naturally along a path of "try first, validate, expand, and then scale deployment." It lowers the barrier to initial evaluation while making subsequent procurement, capacity expansion, and long-term adoption much smoother.
Get Started with OpenTest
OpenTest 1.4.0 Beta is now available. You can download the client from the OpenTest website and start using it for free.
If you are already using OpenTest, this update will bring a more complete and robust experience for sound quality analysis, signal generation, long-duration recording, and sound power testing.
If you are evaluating new software for acoustic and NVH testing, OpenTest 1.4.0 Beta is a great opportunity to see how OpenTest can help you work more efficiently from acquisition to analysis and reporting.
To learn more, upgrade your plan, or further explore OpenTest, please visit the OpenTest website or contact the CRYSOUND team at info@crysound.com.
NEW
OpenTest
Mode
Measure Mode, Analysis Mode, Sequence Mode
Monitor
Scope, FFT Spectrum, Spectrogram,RMS Level, DC Level, Peak Level, THD Ratio, THD+N Ratio, Crosstalk, etc.
Measure
FFT Analysis, Octave Analysis, Continuous Sweep, Stepped Frequency Sweep, Sound Power Testing, Sound Level Meter, Sound Quality, etc.
NEW
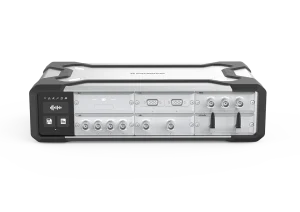
CRY5820 SonoDAQ Pro
lsolation
1000V
Channel
24 channels/Mainframe
Interface
USB-C / 2 x GLAN / 2 x CAN FD / WIFI
NEW
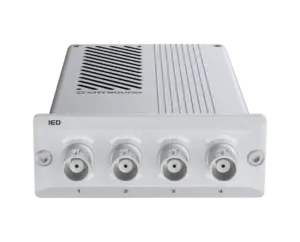
CRY5011 IEPE Analog In-IED
Channel
4
ADC Resolution
32 bit
Sampling Rate
10 Hz ~204.8 kHz, optional
NEW
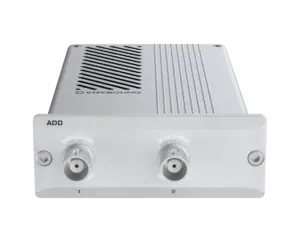
CRY5085 Analog Output Class D 10W - ADD
Channel
2
Sampling Rate
(48 / 96 / 192) kHz,Optional
DAC Resolution
32 bit