CRYSOUND POCKET Acoustic Imaging Camera Now Available on Kickstarter.

Traditional NVH tools still matter, but they don't cover every EV scenario-acoustic cameras fill the gap with real-time noise visualization and wide-band diagnostics.
The Quiet EV Paradox: Why Electric Cars Are Actually "Noisier"
It sounds like a paradox - electric vehicles have no roaring engine, yet engineers are finding it harder than ever to achieve a truly quiet cabin.
The truth is, when the low-frequency masking effect of the internal combustion engine disappears, every previously hidden noise becomes fully exposed: the high-frequency whine of the electric motor, the electromagnetic hum of the inverter, gear meshing vibrations, wind noise, road noise, even the squeak and rattle of interior trim - nothing can hide anymore.
This isn't just a comfort issue. It's fundamentally redefining the automotive industry's approach to NVH (Noise, Vibration, and Harshness) testing.
The global automotive NVH testing market is projected to grow from USD 3.51 billion in 2026 to USD 5.75 billion by 2034, at a CAGR of 6.4%. The core driver behind this growth? The electrification revolution.
What New Noise Challenges Do EVs Bring?
A Fundamental Shift in Frequency Range
Traditional ICE vehicle NVH work focuses on the 20-2,000 Hz low-frequency range - engine firing, exhaust systems, crankshaft vibrations.
Electric vehicles are fundamentally different:
| Noise Source | Typical Frequency Range | Characteristics |
|---|---|---|
| Electric motor electromagnetic noise | 500-5,000 Hz | Sharp tonal noise, varies linearly with speed |
| Inverter switching noise | 4,000-10,000+ Hz | High-frequency hum, related to PWM frequency |
| Gear meshing noise | 800-3,000 Hz | Particularly prominent in single-speed reducers |
| Battery charger noise | 8,000-20,000 Hz | Near-ultrasonic range, at the edge of human perception |
| Wind / Road noise | 200-4,000 Hz | Highly exposed without engine masking |
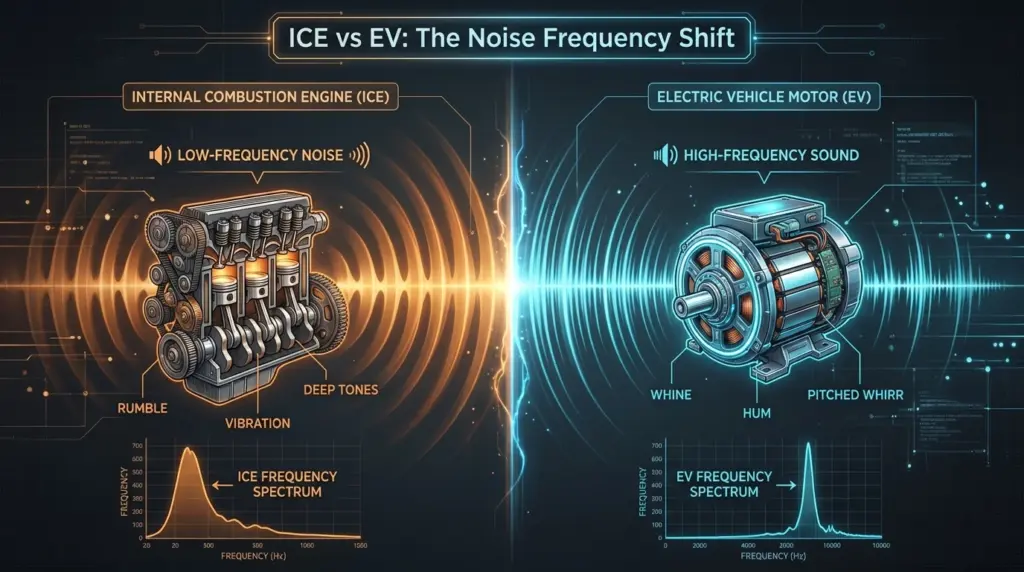
Key insight: EV noise problems shift from low frequencies to mid-high frequencies (and even ultrasonic ranges). The 100Hz-5kHz range is where most critical NVH issues reside-precisely where human hearing is most sensitive. Traditional NVH testing methods and frequency ranges may no longer be sufficient.
New Noise Sources, New Localization Challenges
In the ICE era, the assumption that "the engine is the dominant noise source" made things relatively straightforward.
In EVs, noise sources become more distributed and complex:
- Electric drive system: The motor + inverter + reducer form a highly coupled noise system
- Thermal management: Battery cooling pumps and fans become dominant noise sources at low speeds
- Regenerative braking: Changes in inverter operating modes during energy recovery produce transient noise
- Structural transmission paths: Lightweight body structures (aluminum alloy, carbon fiber) have fundamentally different sound insulation characteristics compared to traditional steel
This means engineers face a core challenge: How do you quickly and accurately locate the root cause among multiple distributed, dynamically changing noise sources?
Sound Quality Design: From "Reducing Noise" to "Crafting Sound"
NVH engineering in the EV era is no longer just about "minimizing noise."
Consumers expect a carefully designed sound experience:
- Acceleration should feel "high-tech" without being harsh
- The cabin should be quiet, but not so silent that it makes the driver uneasy
- Different driving modes (Sport / Comfort / Eco) should deliver differentiated acoustic feedback
This demand for "Sound Design" is expanding NVH testing from pure engineering validation into subjective sound quality evaluation and brand-level acoustic identity.
Why Acoustic Cameras Are Becoming Essential for EV NVH
Facing these new challenges, traditional NVH testing tools - single-point microphones, accelerometers - remain important but are no longer sufficient for every scenario.
Acoustic cameras are filling this gap.
Core Advantages of Acoustic Cameras
1. Real-Time Noise Source Visualization
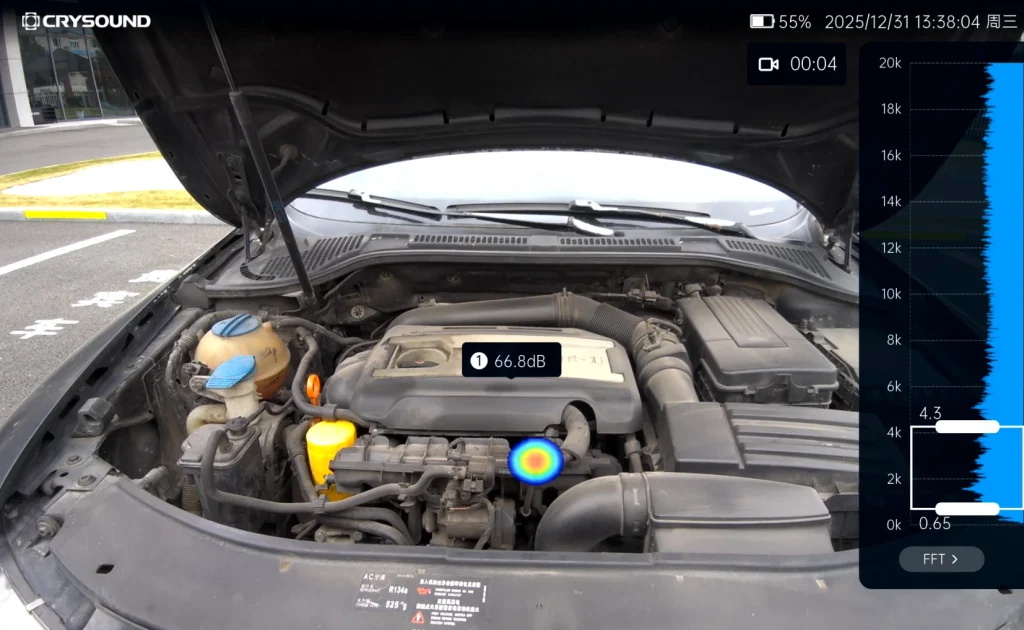
Traditional methods require densely placing microphone arrays on the target object - time-consuming and labor-intensive. Acoustic cameras use beamforming technology to generate a noise source heatmap in a single capture, instantly showing "where the noise is and how loud it is."
Typical scenario: An EV prototype running on a test bench, the acoustic camera aimed at the electric drive system, instantly revealing that an 800 Hz resonance originates primarily from the right side of the motor - the entire localization process takes less than 5 minutes.
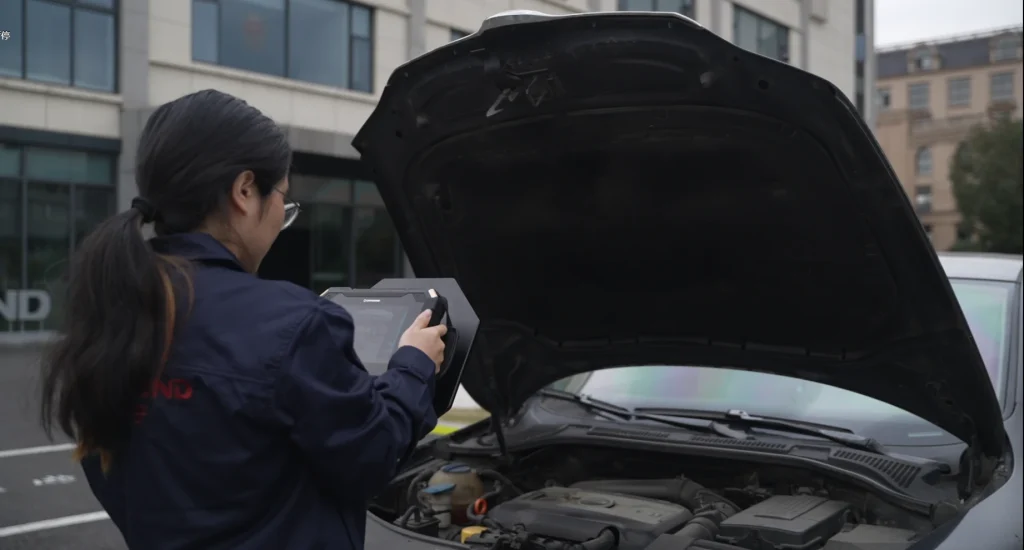
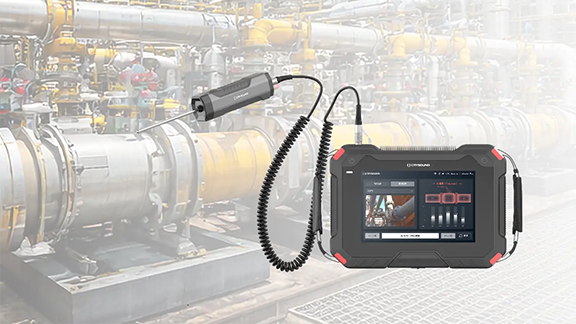
Engineer conducting noise source localization test
Automotive NVH detection and optimization
2. Wide Frequency Coverage
EV noise spans from hundreds of hertz (gear meshing) to tens of thousands of hertz (inverter switching noise) - an enormous frequency range.
Critical consideration for NVH: Most EV noise issues occur in the 100Hz-5kHz range-gear meshing, motor electromagnetic noise, wind leaks, HVAC systems. Traditional acoustic imaging cameras (limited to frequencies above 5 kHz) cannot capture these noise sources.
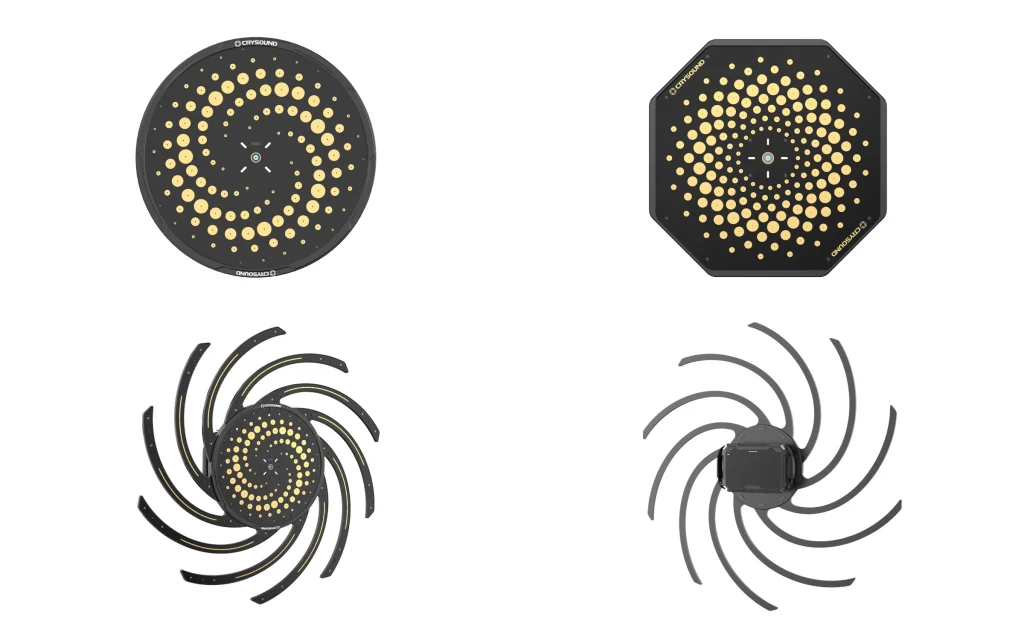
Take the CRYSOUND SonoCam Pi (CRY8500 Series) as the ideal example: its 208 MEMS microphone array provides:
- Beamforming frequency range: 400 Hz - 20 kHz (covers the entire NVH audible spectrum)
- Near-field acoustic holography range: 40 Hz - 20 kHz (captures low-frequency road noise and structural vibration)
- Array size: >30 cm (optimized for low-frequency spatial resolution)
This makes SonoCam Pi uniquely suited for full-spectrum EV NVH testing-from low-frequency road noise to high-frequency motor whine, all in a single handheld device.
3. Non-Contact Measurement
EV electric drive systems are highly integrated and spatially compact. The non-contact measurement approach of acoustic cameras means:
- No disassembly of any components required
- No interference with the operating state of the system under test
- Rapid quality inspection directly on the production line
4. Portability
Modern handheld acoustic cameras like the SonoCam Pi can be taken directly to proving grounds, production lines, or customer sites, no complex setup required.
Typical Application Scenarios in EV NVH
| Scenario | Application |
|---|---|
| E-drive system NVH | Locating order-based noise contributions from motors, inverters, and reducers |
| Pass-by noise testing | Analyzing noise source distribution as vehicles pass by |
| Interior squeak & rattle tracking | Locating noise from dashboards, doors, seats, and trim |
| End-of-line production QC | Rapid online detection of abnormal noise, replacing subjective human judgment |
| Wind tunnel / Semi-anechoic chamber | High-precision noise source localization and sound power analysis |
Real-World Case Study: OEM Dynamic Road Testing
Client: A leading Chinese OEM
Location: An OEM test center, internal test track
Objective: Identify in-cabin noise sources during dynamic driving conditions
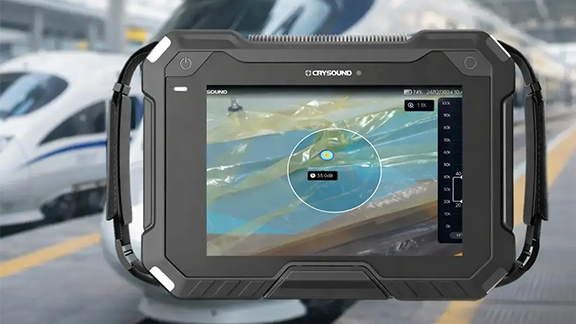
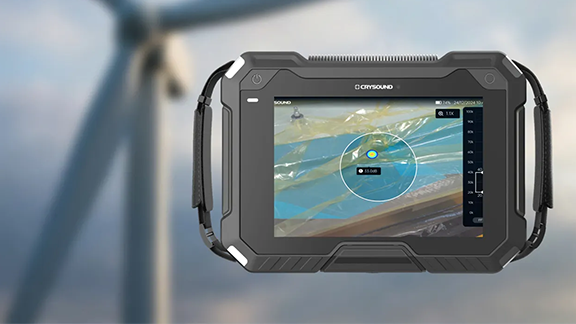
CRY8500 Series SonoCam Pi acoustic cameras
Test Setup
- Device:SonoCam Pi acoustic camera
- Measurement positions:Rear seat and front passenger seat
- Target areas:Left and right B-pillars (rear cabin area)
- Test mode:Beamforming app
- Frequency range:3,550 Hz - 7,550 Hz
- Dynamic range:5 dB
Key Results
SonoCam Pi successfully localized noise sources in real-time during vehicle motion, providing actionable data for OEM's NVH engineering team. The test demonstrated:
- Real-time localization during dynamic conditions: Unlike fixed laboratory setups, SonoCam Pi captured noise distribution while the vehicle was in motion on the test track
- Precise frequency-band analysis: By focusing on the 3,550-7,550 Hz range (critical for perceived cabin noise), engineers pinpointed specific contributors rather than measuring overall SPL
- Rapid testing workflow: Complete B-pillar area scan in minutes, not hours
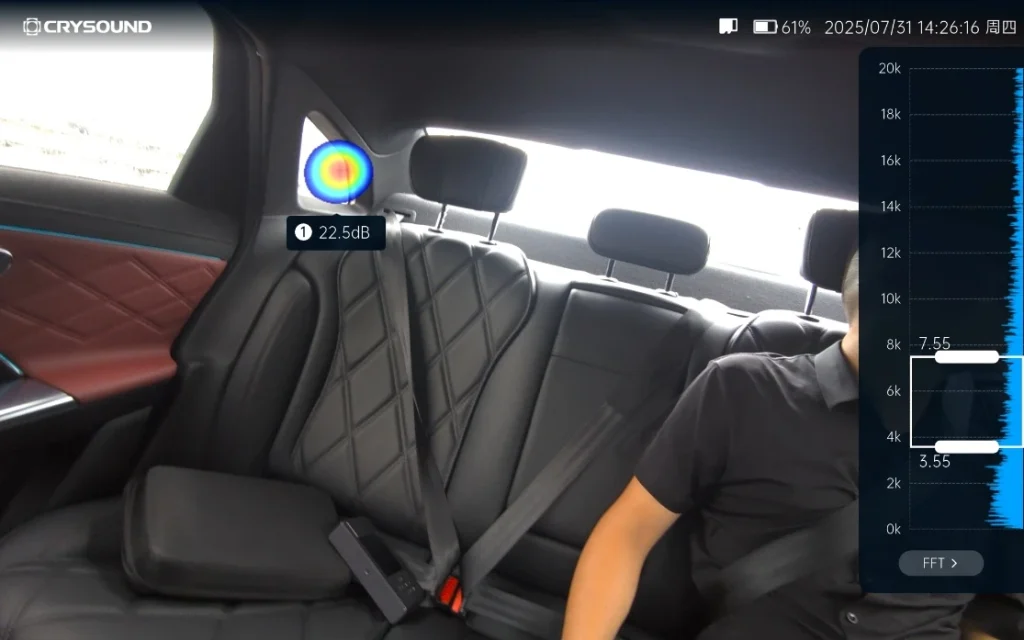
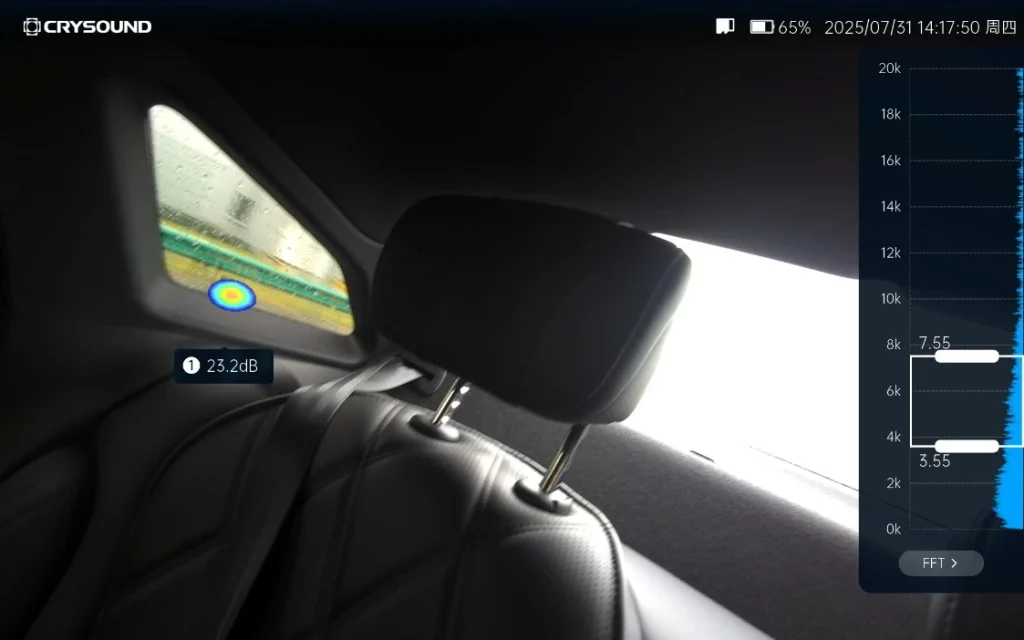
Noise Source Localization Results
Key Insight: Traditional microphone arrays would require the vehicle to be stationary in a semi-anechoic chamber. SonoCam Pi enabled on-track diagnostics, dramatically reducing testing time and enabling rapid iteration during vehicle development.
Future Trends - What's Next for EV NVH Testing?
AI-Driven Noise Classification
Machine learning is being integrated into NVH testing workflows: automatically identifying noise types, determining whether anomalies exist, and predicting potential quality issues. The high-dimensional data captured by acoustic cameras is naturally suited for AI analysis.
Digital Twins and Simulation-Test Integration
Simulation (CAE) predicts noise performance → Acoustic camera validates through physical measurement → Data feeds back to optimize the simulation model. This closed-loop approach is becoming the standard workflow for major OEMs.
New Challenges in the Solid-State Battery Era
Solid-state batteries have different mechanical properties compared to liquid lithium-ion batteries. Their vibration transmission characteristics and thermal management approaches will introduce new NVH challenges.
Stricter Regulations
Pass-by noise testing is the fastest-growing NVH sub-segment (CAGR 7.11%), with UNECE pushing for stricter standardized testing requirements, including indoor pass-by testing protocols.
Conclusion: The Value of Acoustic Testing, Redefined for the EV Era
Electrification hasn't made cars quieter - it has made noise challenges more complex, more nuanced, and more valuable to solve.
For automotive OEMs, Tier 1 suppliers, and testing service providers, investing in the right NVH testing equipment is no longer a "nice-to-have" - it's foundational infrastructure for competitiveness.
Acoustic cameras-especially those capable of capturing the critical 100Hz-5kHz NVH frequency range-are evolving from "useful auxiliary tools" to "indispensable standard equipment."
The CRYSOUND SonoCam Pi stands out as the only handheld acoustic camera that combines:
- Low-frequency capability (400 Hz beamforming, 40 Hz holography)
- High spatial resolution (208 microphones, >30 cm array)
- Near-field + far-field measurements in a single system
- Portability (handheld, <3 kg, production-ready)
Learn more:
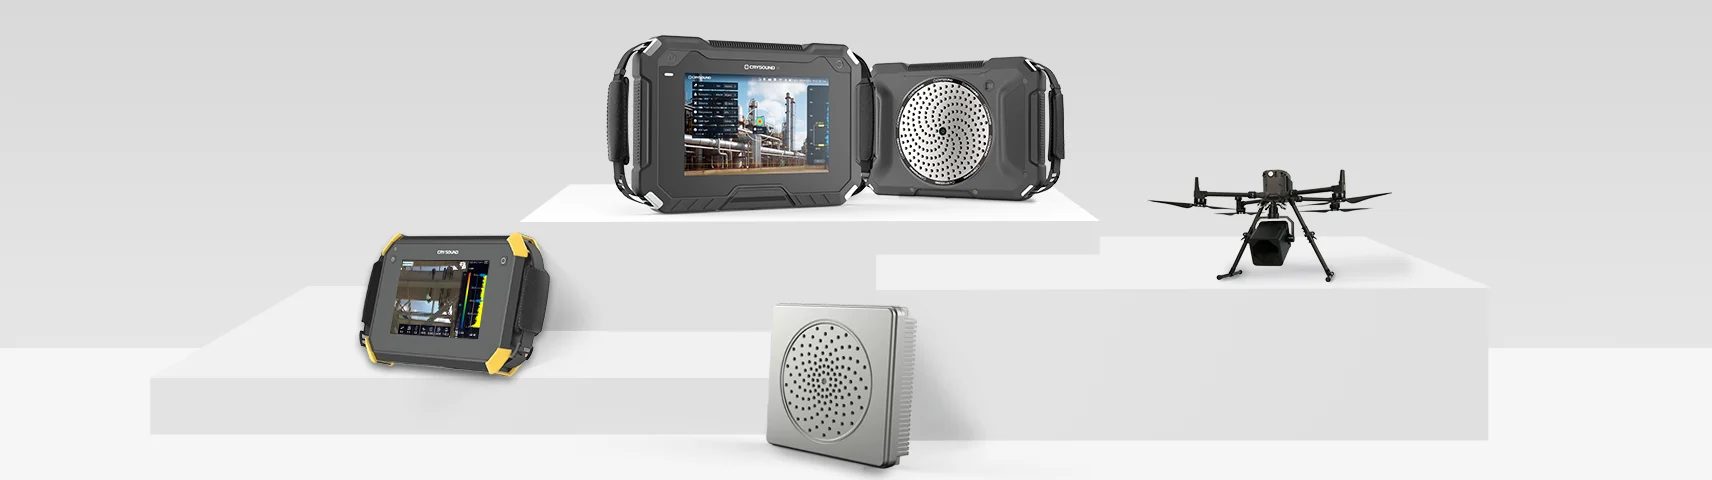
NEW
CRY8500 Series SonoCam Pi Acoustic Camera
Mic Array
128, up to 208 channels
Beamforming Frequency
200 - 20k Hz (110cm array)
NAH Frequency
20 - 20k Hz (110cm array)
NEW
CRY8124 Advanced Acoustic Imaging Camera
Microphone array
200 channels MEMS microphone
Frequency range
2k - 100k Hz
SPL range
28 - 132 dB
NEW
CRY8125 Advanced Ex Acoustic Imaging Camera
Microphone Array
200 MEMS microphones
Frequency Range
2k - 100k Hz
SPL Range
28 - 132 dB