
Sound power testing is used to quantify the total acoustic energy radiated by equipment, with sound power level, Lw, as the key metric. Unlike sound pressure level, which only indicates how loud a sound is at a particular point, sound power is better suited to noise benchmarking and compliance declarations across sites, laboratories and production batches. This article starts with the relationship between sound pressure, sound intensity and sound power, explains why industry uses sound power, and summarises the main sound-pressure and sound-intensity standards, including ISO 3744, ISO 3745, ISO 3746 and ISO 9614, together with practical implementation points.
1. Why Industry Needs Sound Power
Before discussing sound power testing, it is important to understand the basic concepts of sound pressure, sound intensity, and sound power. For this part, you can refer to the blog post below.
https://www.crysound.com/blog/what-are-sound-pressure-sound-intensity-and-sound-power
In product noise assessment, sound pressure level alone is not sufficient when results need to be comparable across sites, organisations and production batches. Sound pressure level reflects the effective sound pressure at a specific position in space, and the measured value is affected by measurement distance, installation conditions, background noise and other factors. For the basic concepts of sound pressure, sound intensity and sound power, please refer to the content linked below.
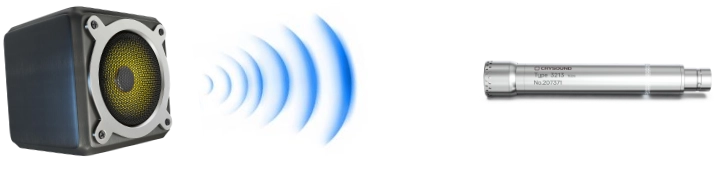
As shown in Figure 1, the sound pressure level measured by a microphone will inevitably vary with its distance from the sound source. For directional sources, there can also be a substantial difference between measurements taken with the microphone facing towards the source and those taken behind it.
Sound power describes the rate at which a sound source radiates acoustic energy. In principle, it is an inherent radiation characteristic of the source. By definition, sound power is not a point quantity; it is obtained by integrating the energy flow over an enveloping surface. This conversion from a point measurement to a surface-based quantity greatly reduces the influence of local fluctuations, incidental measurement points and spatial non-uniformity caused by reflections. At the same time, standardised measurement surfaces, microphone positions, environmental criteria and correction methods enable sound power measurement to represent the true noise radiation level of the source.
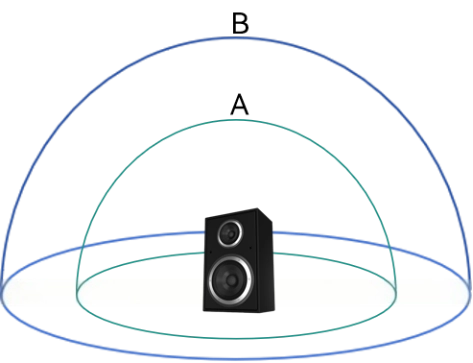
As shown in Figure 2, according to the calculation formula specified in sound power testing standards, when an A-size frame is used, the enveloping measurement area is smaller than that of a B-size frame, but the corresponding measured sound pressure level is higher. These two factors offset each other in the calculation, so the overall sound power level should remain unchanged.
2. Sound Power Testing System
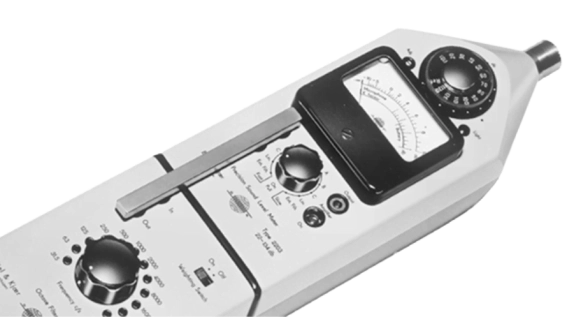
In the 1960s, engineers commonly used sound level meters to measure sound pressure level when assessing the noise rating of equipment. However, the value for the same machine could change when the room or measurement distance changed, prompting industry to move towards sound power testing. Early forms of international standardisation for sound power determination appeared quite early, for example ISO 495:1966, which specified machine installation and operating conditions, the acoustic quantities to be used, and the derivation of sound power from measured data in typical environments such as free-field rooms and reverberation rooms. Later sound power standards such as ISO 3740, ISO 3744 and ISO 3745 often note 'Previously ISO 495:1966', reflecting the continuation and refinement of that early framework.
2.1 Sound-Pressure-Based Sound Power Testing
2.1.1 Development of the Test Method
By the 1970s, industrial demand for sound power testing had become much more stringent, and earlier sound power measurement methods no longer delivered the required accuracy. Two main routes therefore emerged: the reverberation-room sound pressure method and the anechoic/semi-anechoic room sound pressure method.
- Engineering method in a reverberation room: this method also determines sound power in a reverberation room and is covered by ISO 3743. Compared with ISO 3741, it is an engineering-grade implementation of the same principle. It is intended for small, movable sound sources, improving usability and efficiency, and is divided into the comparison method for hard-walled test rooms (ISO 3743-1) and the reverberation test room method (ISO 3743-2).
- Precision method in a reverberation room: the sound source is placed in a reverberation test room, where multiple reflections cause the sound field to approach a diffuse condition. Spatially averaged sound pressure levels are obtained at specified measurement positions and, together with the sound absorption characteristics of the room, are used to back-calculate the sound power level. This establishes a stable relationship between average sound pressure and sound power. The first edition of ISO 3741 was published in 1975. It was subsequently revised, with the fourth edition published in 2010, standardising precision-grade sound pressure measurement in reverberation test rooms.
- Precision method in anechoic or semi-anechoic rooms: this method imposes strict acoustic requirements on the room, suppresses reflections to a sufficiently low level, and derives sound power from sound pressure. ISO 3745 standardised this method in 1977. After several rounds of revision, it developed into ISO 3745:2012 and continues to be maintained.
- Survey/engineering methods in anechoic or semi-anechoic rooms: in practical engineering, precision methods are relatively costly. ISO 3746, introduced in 1979 as a survey method, therefore allowed more relaxed site conditions and used sound pressure measurements over an enveloping measurement surface to produce survey-grade results. In 1981, ISO 3744 introduced the engineering method, using a hemi-free field as a compromise. Rather than requiring a completely reflection-free environment, it controls errors within an engineering-grade range through a standardised measurement surface, microphone positioning and environmental corrections.
- In-situ comparison method: many sites neither satisfy free-field conditions nor form an ideal diffuse field, yet sound power still has to be assessed at the installation site. ISO 3747 addresses this situation. The method measures the sound pressure level of the source under test in its actual operating environment and also measures the sound pressure level of a calibrated reference sound source with known sound power. The sound power level of the source under test is then obtained by comparison.
2.1.2 Measurement Principle
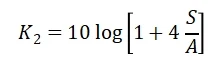
Sound-pressure-based methods determine the sound power of a source by measuring sound pressure levels over a defined measurement surface and applying environmental correction factors. Before testing, the background noise is generally required to be a specified amount below the level of the source under test. Depending on the environment, the measured values are corrected using factors such as the background noise correction K₁ and the environmental correction K₂. The core formula for calculating sound power level is:
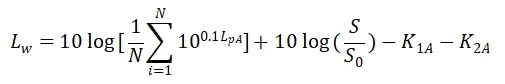
where LpA is the A-weighted time-averaged sound pressure level; N is the number of microphones; S is the area of the enveloping surface; S0 is the reference area (1 m²); K1A is the background noise correction; and K2A is the environmental correction.
2.1.3 Measurement Surface Definition and Microphone Positioning Rules
According to the standards, an imaginary closed or semi-closed surface is defined around the sound source, and microphones are placed at selected measurement positions on that surface to measure the sound pressure level at each point. Common measurement surface shapes include:
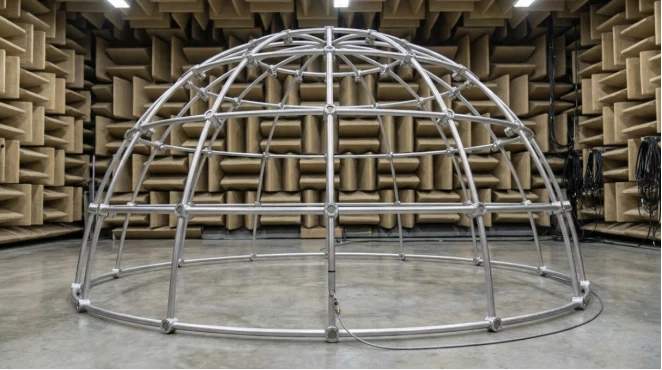
- Hemispherical surface: suitable when the source is placed on a reflecting plane, with the centre of the hemisphere usually located at the geometric centre of the source. The advantage of a hemispherical surface is that it only needs to cover the upper half-space, allowing the source to be enclosed and sound power to be obtained using fewer measurement points. Survey methods typically use 4-8 points, while precision methods may use 20-40 points, with an even distribution required. If the source is highly directional and different positions show large differences in sound pressure level, the number of microphones should be increased to improve spatial density.
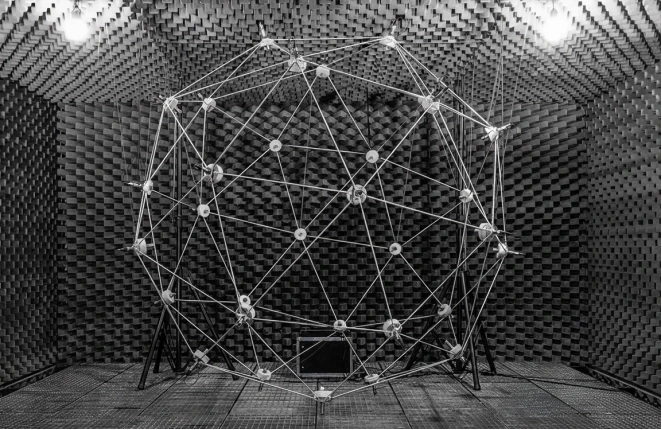
- Spherical surface: suitable for measuring a source suspended in a free-field condition. Measurement points must be distributed evenly over an imaginary spherical surface enclosing the source. A spherical surface normally requires more points to cover all directions; it is generally used only for precision methods, typically with 20 or more measurement points.
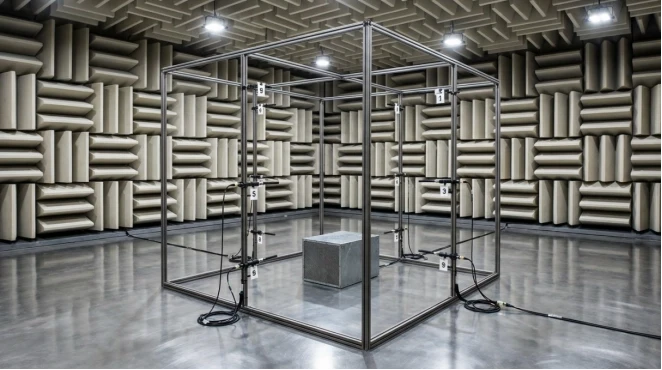
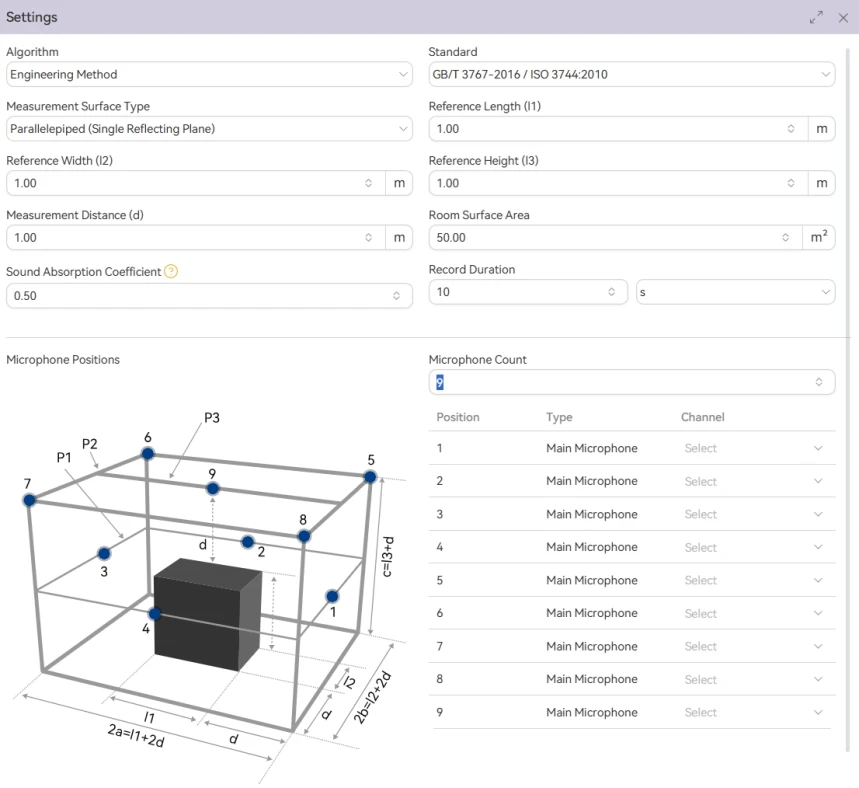
- Cuboid surface: a rectangular six-sided surface surrounding the source, with microphone positions arranged at the centre of each face and at the corners. It is suitable for equipment with a near-cuboid shape or a clearly defined main radiation direction. The standards allow cuboid measurement surfaces to be used in engineering and survey methods, provided that the number of measurement points is increased to cover each face, for example at least one point per face, or four points per face for improved accuracy, giving 24 points in total. The area of each face should be kept as consistent as possible. When using a cuboid surface, the position of each measurement point must therefore be calculated from the size of the object under test and the distance to the cuboid surface.
Whichever measurement surface is used, the microphone positions should cover the entire enveloping surface evenly so that each point contributes approximately equally to the overall sound power. The standards usually provide recommended measurement coordinates. The microphones should be at equal distances from the source and should be located in the far field. In engineering and precision methods, typical radii are 1 m or 1.5 m. In reverberation-room methods, the source must be more than a specified distance from the walls, for example greater than 1.5 m, to allow sufficient diffusion of acoustic energy.
If a single microphone is used to measure the positions sequentially, the operating condition of the source and the background noise must remain stable, and all positions should be measured as quickly as possible to minimise the effect of time drift. In addition, the microphone and measurement system should meet Class 1 accuracy requirements to reduce the influence of instrumentation error on the result.
2.1.4 Background Noise and Environmental Corrections
In sound power calculations, the background noise correction K1 and the environmental correction K2 are two key correction quantities. They compensate respectively for the influence of background noise and the measurement environment.
- Background noise correction K1: when background noise is present while the source under test is operating, the measured sound pressure level will be too high. K₁ corrects for the effect of background noise and is determined from the difference ΔL between the sound pressure level with the source operating and with the source switched off. If ΔL is large, K₁ may be taken as 0; if ΔL is small, it is calculated as follows:
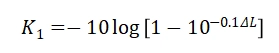
Precision methods require the background noise to be at least 10 dB below the source under test, corresponding to K₁ of not more than about 0.4 dB. Engineering methods require a difference of at least 6 dB, corresponding to K₁ <= 1.3 dB. Survey methods allow a difference of at least 3 dB, with K₁ reaching up to about 3 dB. If the background noise correction is too large, the measurement uncertainty increases significantly and the test environment should be improved.
- Environmental correction K2: K₂ corrects for errors introduced by the test environment. In an ideal free field or hemi-free field, K₂ = 0. If the test site has wall reflections, insufficient sound absorption or similar issues, the distribution of sound pressure levels at the measurement positions will be affected. K2 can be calculated in two ways:
- (1) the reference sound source comparison method, where a standard source with known sound power is measured at the same site and the result is compared with its certified value to calculate K₂;
- (2) calculation of K₂ from the equivalent sound absorption area of the room, as follows:
where S is the area of the measurement surface and A is the sound absorption of the room.
For outdoor sites, if there are no significant reflecting objects and the ground has good sound absorption, K₂ may be regarded as approximately 0. Precision methods require K₂ <= 0.5 dB, engineering methods require K₂ <= 2 dB, and survey methods require K₂ <= 7 dB. If the on-site environment does not meet these criteria, the test environment should be improved by increasing sound absorption or avoiding reflective directions.
2.2 Sound-Intensity-Based Sound Power Testing
2.2.1 Development of the Test Method
Accurate sound-pressure-based sound power testing depends heavily on reverberation rooms or anechoic rooms. For large equipment, however, it is often difficult to build a suitably sized anechoic room or to find a sufficiently good hemi-free-field environment. The sound intensity method addresses this core difficulty: because sound intensity is a vector quantity, it is more resistant to reflections and background noise, allowing the net energy flow through an enveloping surface to be integrated into sound power.
- The publication of ISO 9614-1 in 1993, covering the discrete-point method, marked the formal entry of sound-intensity-based methods into the international standards system. It measures the normal component of sound intensity over an enveloping measurement surface and obtains sound power by area integration.
- ISO 9614-2, published in 1996, advanced the approach from point measurement to surface scanning and significantly improved efficiency. Continuous scanning paths are used to cover sub-areas, and the instrument provides the mean normal sound intensity and related statistics over the scanning period.
- ISO 9614-3, published in 2000, further strengthened the requirements for measurement-surface subdivision, scanning-path coverage, statistics and quality control, as well as the criteria relating to measurement quality and uncertainty.
2.2.2 Measurement Principle
When discussing sound power testing by the sound intensity method, it is useful first to recall the definition of sound power: for any closed measurement surface S enveloping a sound source, sound power is equal to the integral of the normal component of sound intensity over that surface.
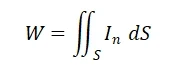
From the sound power calculation formula, the measurement surface is divided into many small elements. The time-averaged sound intensity In perpendicular to each element is measured, multiplied by the element area Si, and the contributions from all elements are then summed to obtain the total sound power of the source.
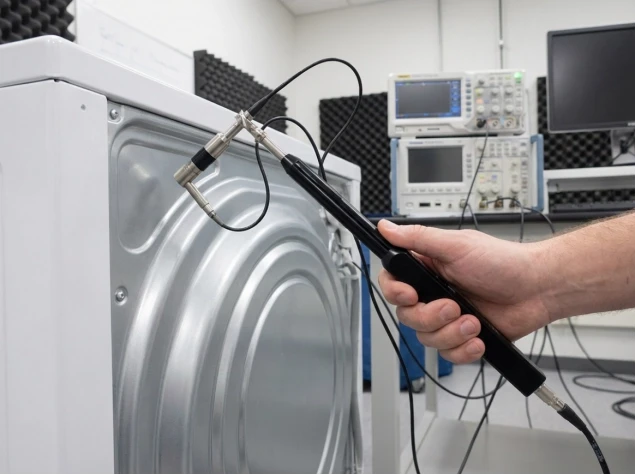
The essence of the sound intensity method is therefore to measure the distribution of normal sound intensity over the enveloping measurement surface, which requires a sound intensity probe. During actual measurement, the probe must always be held perpendicular to the measurement surface; otherwise, any deviation from the normal direction reduces the effective sound intensity being measured.
2.2.3 Standard Methods and Implementation
As described in Section 2.2.1, ISO 9614 standardises sound power determination based on sound intensity measurement. It is divided into three parts, corresponding to three implementation methods. The underlying principle is the same in all three cases: sound power is obtained from the normal sound intensity over the measurement surface. The main differences lie in the test procedure and accuracy class.
- Discrete-point measurement method (ISO 9614-1):
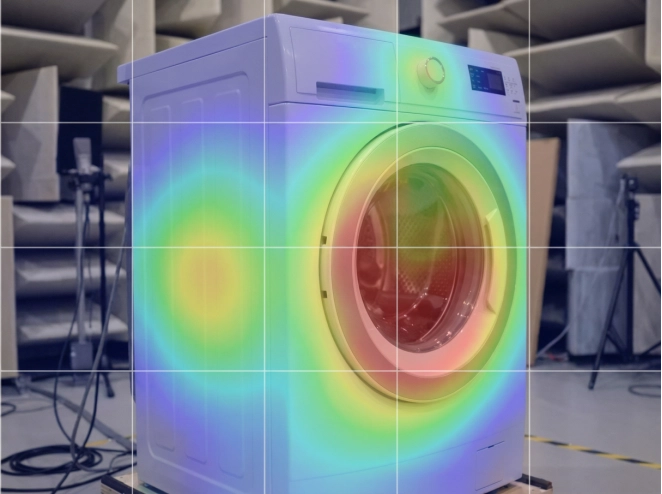
ISO 9614-1 divides the enveloping measurement surface into small rectangular elements. The sound intensity probe is then held steadily at the centre of each rectangular element for a defined period to acquire the acoustic signal and obtain the time-averaged normal sound intensity. Once all rectangular elements have been measured, the sound intensity distribution over the entire measurement surface is obtained. The average intensity at each point is multiplied by the corresponding rectangular area and summed over all elements to obtain the sound power for that surface; the sound powers of all surfaces are then added to obtain the total sound power. The resulting sound intensity map can also show how noise is distributed over the equipment surface, providing valuable information for source localisation.
The discrete-point method is relatively straightforward and easy to implement, as each point is measured individually. It also provides good consistency and repeatability, and because the point positions are fixed, the influence of the operator is relatively small. It is therefore suitable where high repeatability is required or where operator experience is limited. If the point grid is sufficiently fine, it can also achieve high accuracy.
Because the measurement surface has to be divided into a grid, the number of measurement points can be large and a complete test may take considerable time. If the grid is too coarse, however, areas with non-uniform sound intensity distribution may be missed, affecting accuracy. The number of points and the measurement time therefore need to be balanced while maintaining the required accuracy.
- Scanning measurement method (ISO 9614-2)
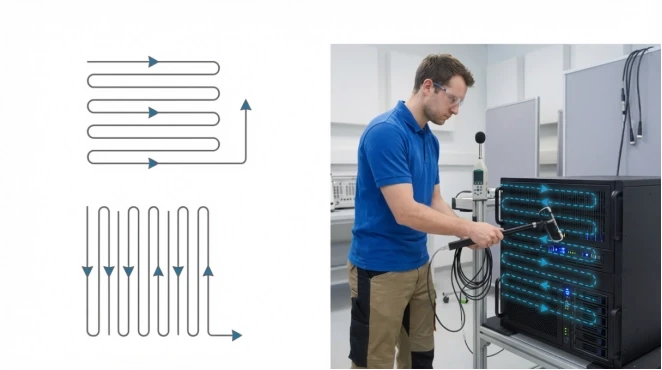
Unlike the discrete-point method, the scanning method requires the engineer to move the sound intensity probe continuously by hand so that it uniformly covers the entire measurement surface. The probe still faces the measurement surface and is moved back and forth at a uniform speed along the path shown below. Sound intensity data are acquired continuously throughout the scan, and the surface is treated as a whole to obtain the mean intensity. Because the scan covers every position on the measurement surface, the resulting mean sound intensity represents the spatial average for that surface. Multiplying this mean intensity by the surface area gives the sound power for that surface.
In theory, the scanning method is closer to a continuous sound intensity integration process, because the probe passes through more, more densely distributed trajectory points and samples the sound field more fully. It typically offers higher accuracy and greater test efficiency. It is therefore well suited to measurements that must be completed within limited time, or to large sources with a very high number of measurement points.
The main source of error in the scanning method is the operator. Differences in scanning speed and trajectory between operators can introduce bias and increase uncertainty. To obtain reliable results, operators must therefore be trained and must scan at the rates and along the paths specified in the standard. In addition, the scanning method produces an average intensity for a surface and cannot provide the local intensity detail available from the discrete-point method, so it is not suitable where fine source localisation is required.
- Precision scanning method (ISO 9614-3)
ISO 9614-3 is an enhanced version of the scanning method designed to obtain higher-accuracy sound power results. The test procedure is similar to ISO 9614-2, using a sound intensity probe to scan the measurement surface, but it imposes stricter requirements on the scanning path, surface integration and data processing. For example, the measurement surface is divided into a regular rectangular grid with an aspect ratio between 0.83 and 1.2; the probe must be scanned along the grid-line direction and each grid section must be fully covered. The standard also specifies additional criteria, such as repeated scans, background noise checks and phase calibration. These measures reduce random and systematic errors during testing and bring the result closer to the true value.
The precision scanning method can deliver sound power values with an accuracy comparable to sound pressure methods. However, it is more complex to implement, places very high demands on the operator and the stability of the equipment, takes longer, and requires every step to be carried out strictly in accordance with the standard. It is therefore used more often in research and calibration-type measurements than in routine engineering work.
2.3 Summary
Based on the overview of the sound power measurement system above, the applicable scenarios and key differences between the various test standards are summarised in the following table:
| Std. | Method | Env. | Class | Pros | Cons |
| ISO 3741 | Pressure | Reverberation room | Precision | Low uncertainty; repeatable | Demanding facility; source/install limits |
| ISO 3743 | Hard-walled / reverberation room | Engineering | Efficient for small movable sources | Limited source types; room still matters | |
| ISO 3745 | Anechoic / semi-anechoic room | Precision | Low systematic error; highly comparable | High facility cost; strict noise/reflection/install criteria | |
| ISO 3744 | Near hemi-free/free field | Engineering | Good accuracy/cost balance; widely applicable | Site qualification required; difficult with limited space or strong reflections | |
| ISO 3746 | Approx. free field | Survey | Low cost; quick on-site assessment | Higher uncertainty; correction-dependent; not for high-accuracy declarations | |
| ISO 3747 | In situ | Engineering / survey | Practical on site | Depends on reference source and repeatable layout/noise conditions | |
| ISO 9614-1 | Intensity | In situ | Precision / engineering / survey | Works in reflective spaces; supports source localisation | Probe/calibration demands; sensitive to airflow and external noise; slow with many points |
| ISO 9614-2 | As above | Engineering / survey | Good for large surfaces; field-friendly | Requires controlled scan path/speed; external noise affects results | |
| ISO 9614-3 | As above | Precision | High data quality | Stringent conditions; complex workflow |
3. Sound Power Testing Solution
To address common challenges in noise compliance, noise control and product optimisation, CRYSOUND provides an integrated sound power testing solution for industrial users. The solution turns the standard workflow for sound-pressure-based sound power testing into a repeatable engineering process: standardised measurement point layout, guided parameter settings, multi-channel synchronous acquisition, automatic calculation of K1/K2 and sound power results, customised reporting and more. This significantly lowers the barrier to testing and improves the consistency and accuracy of sound power results across production batches and laboratories. The solution is applicable to noise rating and regulatory certification for industrial equipment and construction machinery, key automotive and aerospace components, domestic appliances and consumer electronics, power generation and energy storage products, and more.
3.1 Main Application Scenarios
Consumer Electronics and Domestic Appliances
- Noise rating assessment for domestic appliances: sound power testing of vacuum cleaners, washing machines, refrigerators, air conditioners, purifiers and similar products, used for noise grade labelling and external specification declarations;
- Mass-production consistency and sampling acceptance: used to verify noise consistency after batch variations, supplier changes and process adjustments;
General Industrial Equipment
- Rotating machinery and fluid equipment: sound power measurement of pumps, fans, compressors, blowers, vacuum pumps and similar equipment, used for product noise rating assessment and comparison;
- Motors and drive-related equipment: noise testing of motors, gearboxes, couplings and their associated systems, used for structural/process optimisation and supplier technical assessment;
- Cabinets and packaged equipment: noise assessment of electrical cabinets, enclosures and cabinet-type packaged equipment, used for overall equipment noise control;
Automotive and Transport
- Vehicle component noise assessment: sound power testing of electric-drive-related components and accessories, including motors, cooling fans, air compressors, water pumps and transmission-related components, used for supplier solution comparison and component-level NVH evaluation;
- Thermal management and air-conditioning system components: noise measurement of blowers, compressors, condenser/evaporator units, cooling modules and similar components, used for comfort target breakdown and optimisation verification.
Data Centres
- Server and cabinet cooling systems: noise measurement of servers, switches, storage devices and cabinet fan systems, used for cooling solution optimisation and noise control verification.
- Assessment of cumulative effects from plant-room equipment: in densely deployed plant-room or data-centre equipment scenarios, equipment-level noise data are established to support planning and improvement assessment.
Building Services
- Air-handling units and heating/cooling source equipment: sound power testing of packaged air-handling units, fan cabinets, condensing units, heat pumps and similar equipment, used to assess environmental noise impact;
- Ventilation systems and accessories: noise assessment of duct terminal devices, such as diffusers and terminal units, silencers, dampers and related components, used for system noise control and solution comparison.
3.2 Customer Value
Coverage of Multiple Test Standards
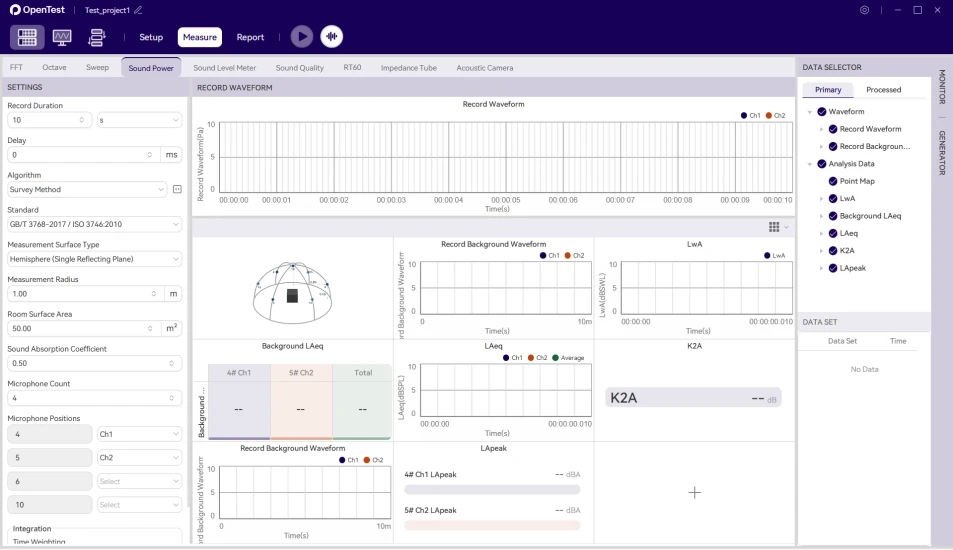
- OpenTest currently supports multiple sound-pressure-based sound power standards (ISO 3744 / ISO 3745 / ISO 3746), and the supporting algorithms for the sound intensity method are under development. The goal is to cover customers' full range of sound power testing requirements with a single software platform;
- OpenTest automatically calculates K1 and K2 values and performs background noise and environmental corrections, helping ensure the accuracy and standard compliance of sound power data;
- While outputting sound power results, OpenTest can also save the original time-domain waveforms and frequency-domain data in full, together with key information such as measurement point details, calibration records and environmental parameters, supporting deeper analysis and data management.
Rapid and Efficient Test Set-up
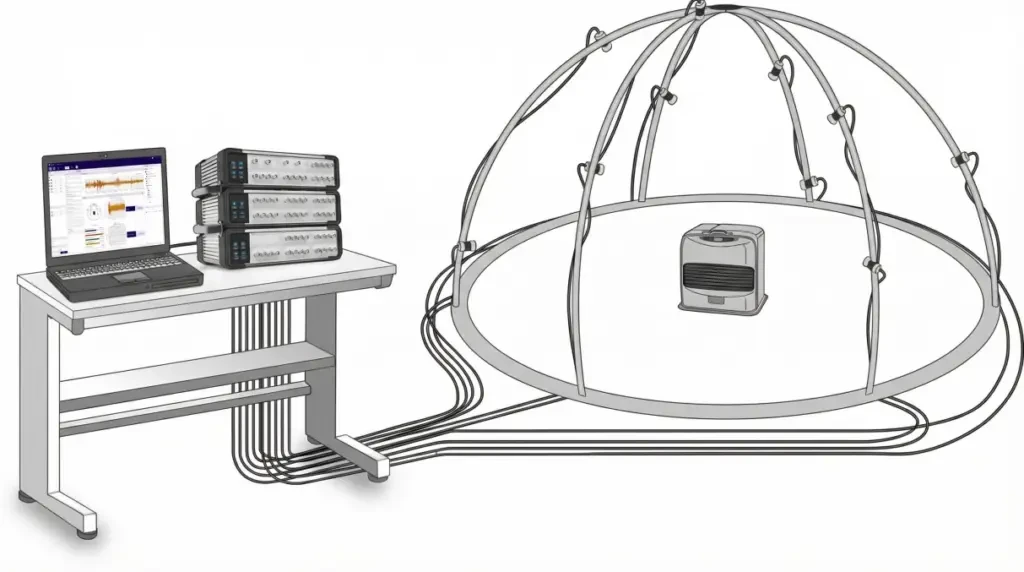
- We provide standard hemispherical frames with radii of 1 m and 1.5 m. Their refined mechanical design makes assembly, disassembly and positioning quick and convenient, helping users save a significant amount of time;
- For cuboid measurement surfaces, OpenTest can automatically calculate the coordinates of each microphone from the reference box dimensions, measurement distance and other parameters, allowing users to set up the test quickly without complex manual calculations;
Diversified Results Display
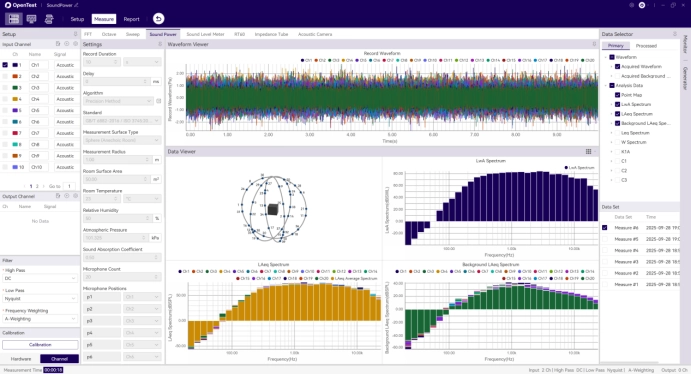
- OpenTest supports multiple display formats, including real-time waveforms, measurement point/layout diagrams, sound pressure level and sound power level curves, 1/3-octave spectra and tabular data, making it easy to review data quickly;
- Charts support zooming, local magnification and interval viewing, enabling detailed analysis of key frequency bands or abnormal time periods;
- OpenTest also supports one-click export of all charts and tables as high-resolution images or data files, making them convenient for test reports, reviews and presentations.
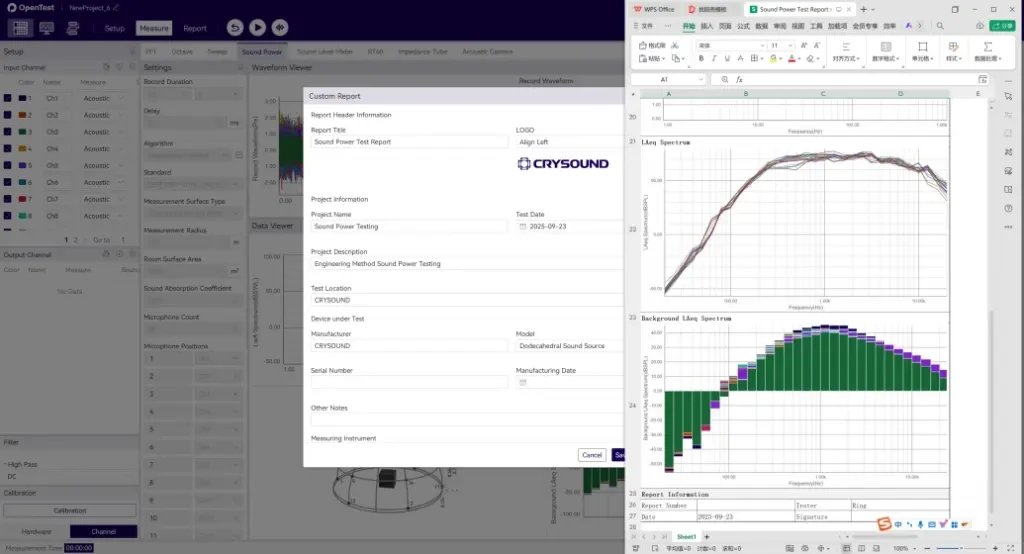
Custom Reports and Automatic Export
- Built-in report templates compliant with ISO standards automatically summarise test information, measurement points and acquisition parameters, calculation results and key charts;
- Custom report structures and content are supported, including company logos, personnel information and notes, with display dimensions selectable as required;
- Reports can be exported with one click, with no need for users to reprocess data or manually edit the test report.
High-performance synchronous acquisition for consistent, reliable test data
- SonoDAQ Pro supports multi-channel synchronous acquisition. A single chassis can cover 24 measurement points, with daisy-chain channel expansion available when more points are required. With PTP technology, inter-channel phase error is kept to <= 100 ns;
- For multi-point acquisition, microphones do not need to be calibrated one by one with a sound calibrator; the sensitivity settings for all microphones can be completed directly using TEDS;
- SonoDAQ Pro provides 1000 V isolation and strong immunity to interference, making it suitable for complex electromagnetic environments.
If you are interested in sound power testing or would like to learn more about CRYSOUND's products, please fill out the Get in Touch form below. Our team will respond as soon as possible.

OpenTest
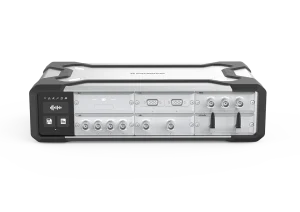
CRY5820 SonoDAQ Pro
.112_结果_结果_2-scaled-2-300x208.webp)
CRY3213 NVH Measurement Microphone
CRY3018 Sound Calibrator
OpenTest
CRY5820 SonoDAQ Pro
CRY3213 NVH Measurement Microphone


