
A data acquisition system (DAQ) is the measurement front end: it converts analog sensor outputs—such as voltage, current, and charge—into digital data. The signal is first conditioned (amplification, filtering, isolation, IEPE excitation, etc.) and then fed to an ADC, where it is digitized at the specified sampling rate and resolution; software subsequently handles visualization, storage, and analysis. This article systematically reviews common DAQ form factors, including PCIe/PXI plug-in cards, external USB/Ethernet/Thunderbolt devices, integrated data recorders, and modular distributed systems. It also summarizes key selection criteria—signal compatibility, channel headroom and scalability, sampling rate and anti-aliasing filtering, dynamic range, THD+N, clock synchronization and inter-channel delay, as well as delivery and after-sales support—to help readers quickly build a clear understanding of DAQ systems.
Why Data Acquisition Matters?
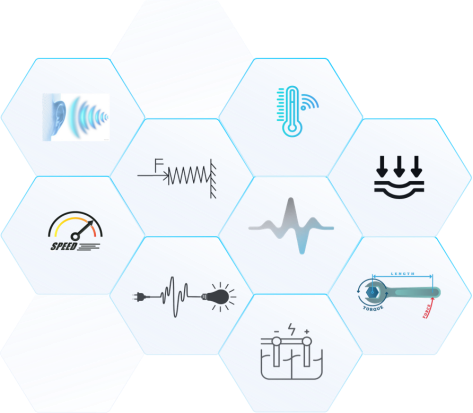
In the real world, physical stimuli such as temperature, sound, and vibration are everywhere. We can sense them directly; in a sense, the human body itself is a “data acquisition system”: our senses act like sensors that capture signals, the nervous system handles transmission and encoding, the brain fuses and analyzes the information to make decisions, and muscles execute actions—forming a closed feedback loop.
Progress in science and engineering ultimately comes from observing, understanding, and validating the world with more reliable methods. Physical quantities such as temperature, sound pressure, vibration, stress, and voltage are the primary carriers of information. However, human perception is subjective and cannot quantify these changes accurately and repeatably; and in high-current, high-temperature, high-stress, or high-SPL environments, direct exposure can even cause irreversible harm. To enable measurement that is quantifiable, recordable, and safer, data acquisition systems (DAQ) came into being.

Put simply, a data acquisition system (DAQ) is an analog front end that converts a sensor’s analog output (voltage/current/charge, etc.) into digital data at a defined sampling rate and resolution, and hands it to software for display, logging, and analysis (typically with the required signal conditioning). It helps engineers see problems more clearly—and solve them.
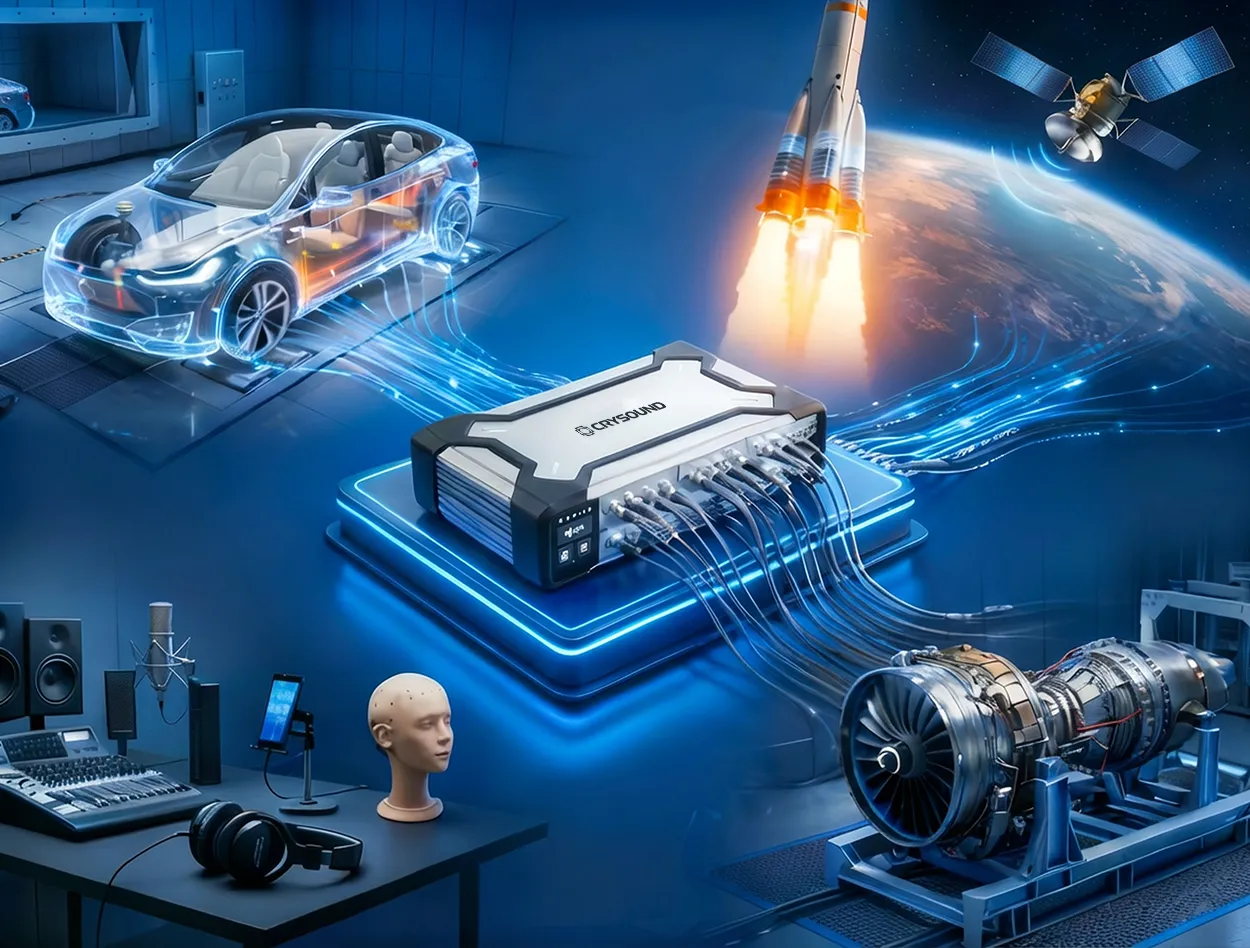
In today’s development cycles—from cars and aircraft to consumer electronics—it’s difficult to validate performance, safety, and reliability efficiently without data acquisition. In durability testing, DAQ records cyclic load and strain for fatigue-life analysis; in noise control, synchronous multi-point acquisition of vibration and sound pressure helps identify noise sources and transmission paths. This quantitative capability is what provides a scientific basis for engineering improvements.
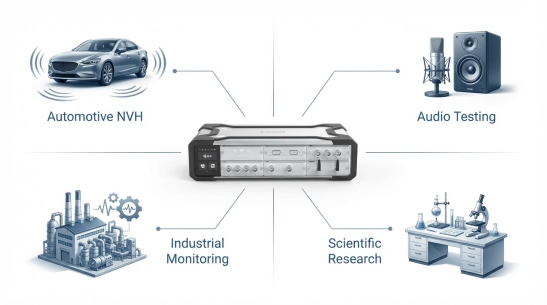
DAQ applications span a wide range of fields:
- Automotive NVH and mechanical vibration testing: Used to acquire body vibration, noise, engine balance, structural modal data, and more—helping engineers improve vehicle ride comfort.
- Audio testing: In the development and production of speakers, microphones, headphones, and other audio devices, DAQ is used to measure frequency response, SPL, distortion, and more, to verify acoustic performance.
- Industrial automation and monitoring: DAQ is widely used for process monitoring, condition monitoring, and industrial control. For example, it acquires temperature, pressure, flow, and torque sensor signals to enable real-time monitoring and alarms, and it often must run continuously with high stability and strong immunity to interference.
- Research labs and education: From physics and biology experiments to seismic monitoring and weather observation, DAQ is a basic tool for capturing raw data. It makes data recording automated and digital, which simplifies downstream processing.
As quality and performance requirements continue to rise across industries, DAQ has become an indispensable set of “eyes and ears,” giving engineers the ability to observe and interpret complex phenomena.
Common DAQ Form Factors
Depending on interface, level of integration, and the application, DAQ hardware comes in several common forms. Below are a few typical DAQ card/system categories:
| Type | Form factor / Interface | Advantages | Limitations | Typical Application |
| Plug-in DAQ card | PCIe / PXI / PXIe | Low latency; high throughput; strong real-time performance | Not portable; requires chassis/industrial PC; expansion limited by platform | Fixed labs; rack systems; high-throughput acquisition |
| External DAQ device | USB / Ethernet / Thunderbolt | Portable; fast setup; laptop-friendly | Bandwidth/latency depends on interface; driver stability is critical; mind power and cabling | Field testing; mobile measurements; general-purpose DAQ |
| Integrated data recorder | Built-in battery/storage/display (standalone) | Ready out of the box; easy in the field; straightforward offline logging | Channel count/algorithms often limited; weaker expandability; post-processing depends on export | Patrol inspection; quick diagnostics; long-duration offline logging |
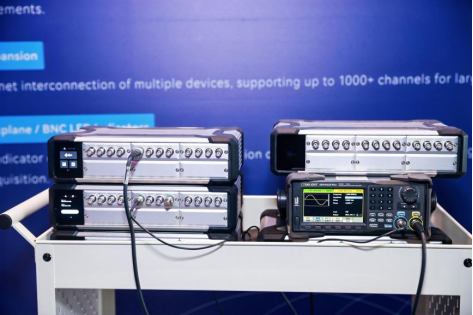
| Modular distributed system | Mainframe + modules; network expansion (synchronized) | Mix signal types as needed; easy channel scaling; strong synchronization | Planning matters: sync/clock/cabling; system design becomes more important at scale | Synchronized Multi-Physics Measurement;High-Channel-Count Scalability;Distributed, Multi-Site Testing |
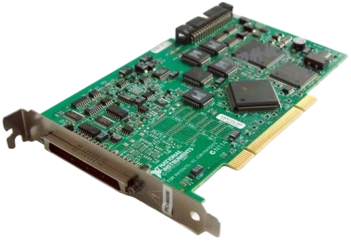
- Plug-in DAQ cards (internal): These are boards installed inside a computer, with typical interfaces such as PCI, PCIe, and PXI (CompactPCI). They plug directly into the PC/chassis bus and are powered and controlled by the host, providing high bandwidth and strong real-time performance for high-throughput applications in desktop or industrial PC environments. The trade-off is portability—these are usually used in fixed labs or rack systems.
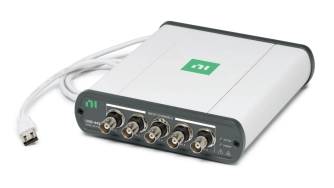
- External DAQ devices (modules): DAQ hardware that connects to a computer via USB, Ethernet, Thunderbolt, and similar interfaces. USB DAQ is common—compact, plug-and-play, and well-suited to laptops and field testing. Ethernet/network DAQ enables longer cable runs and multi-device connections. External units are generally portable with their own enclosure, but high-end models may be somewhat limited in real-time performance by interface bandwidth (USB latency is typically higher than PCIe).
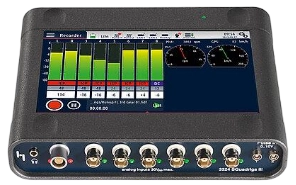
- Portable / integrated data recorders: These integrate the DAQ hardware with an embedded computer, display, and storage to form a standalone instrument. They’re convenient in the field and can acquire, log, and do basic analysis without an external PC. Examples include portable vibration acquisition/analyzer units with tablet-style displays and handheld multi-channel recorders. They are typically optimized for specific applications, ready to use out of the box, and well-suited for mobile measurements or quick on-site diagnostics.
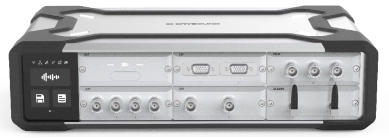
- Modular distributed DAQ system platform: Built from multiple acquisition modules and a main controller/chassis, allowing flexible channel scaling and mixing of different function modules. Each module handles a certain signal type or channel count and connects to the controller (or directly to a PC) over a high-speed, time-synchronized network (e.g., EtherCAT, Ethernet/PTP). This architecture offers very high scalability and distributed measurement capability; modules can be placed close to the test article to reduce sensor cabling. For example, CRYSOUND’s SonoDAQ is a modular platform: each mainframe supports multiple modules and can be expanded via daisy-chain or star topology to thousands of channels. Modular systems are a strong fit for large-scale, cross-area synchronized measurement.
What Makes Up a DAQ System?
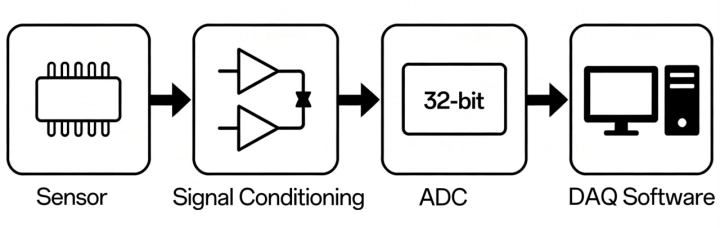
A complete data acquisition system typically includes the following key building blocks:
- Sensors: The front end that converts physical phenomena into electrical signals—for example, microphones that convert sound pressure to voltage, accelerometers that convert acceleration to charge/voltage, strain gauges that convert force to resistance change, and thermocouples for temperature measurement;
- Signal conditioning: Electronics between the sensor and the DAQ ADC that adapts and optimizes the signal.Typical functions include gain/attenuation (scaling signal amplitude into the ADC input range), filtering (e.g., anti-aliasing low-pass filtering to remove noise/high-frequency content), isolation (signal/power isolation for noise reduction and protection), and sensor excitation (providing power to active sensors, such as constant-current sources for IEPE sensors).
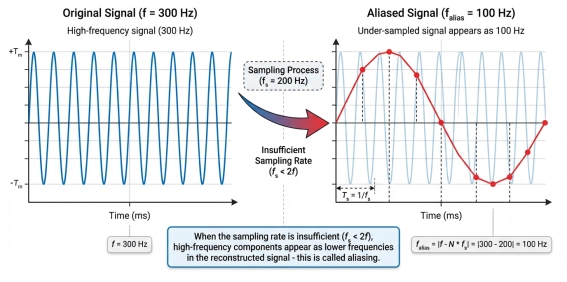
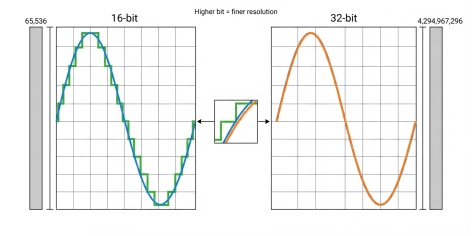
- Analog-to-digital converter (ADC): The core component that converts continuous analog signals into discrete digital samples at the configured sampling rate and resolution. Sampling rate sets the usable bandwidth (it must satisfy Nyquist and include margin for the anti-aliasing filter transition band), while resolution (bit depth) affects quantization step size and usable dynamic range. Many DAQ products use 16-bit or 24-bit ADCs; in high-dynamic-range acoustic/vibration front ends (such as platforms like SonoDAQ), you may also see 32-bit data output/processing paths to better cover wide ranges and weak signals (depending on the specific implementation and how the specs are defined).
- Data interface and storage: The ADC’s digital data must be delivered to a computer or storage media. Plug-in DAQ writes directly into host memory over the system bus. USB/Ethernet DAQ streams data to PC software through a driver. In addition to USB/Ethernet/wireless data transfer, SonoDAQ also supports real-time logging to an onboard SD card, allowing standalone recording without a PC—useful as protection against link interruptions or for long-duration unattended acquisition.
- Host PC and software: This is the back end of a DAQ system. Most modern DAQ relies on a computer and software for visualization, logging, and analysis. Acquisition software sets sampling parameters, controls the measurement, displays waveforms in real time, and processes data for results and reporting. Different vendors provide their own platforms (e.g., OpenTest, NI LabVIEW/DAQmx, DewesoftX, HBK BK Connect). Software usability and capability directly impact productivity. In addition, CRYSOUND’s OpenTest supports protocols such as openDAQ and ASIO, enabling configuration with multiple DAQ systems.
What Specs Matter When Selecting a DAQ?
Three common selection pitfalls:
- Focusing only on “sampling rate / bit depth” while ignoring front-end noise, range matching, anti-aliasing filtering, and synchronization metrics: the data may “look like it’s there,” but the analysis is unstable and not repeatable.
- Sizing channel count to “just enough” with no headroom: once you add measurement points, you’re forced to replace the whole system or stack a second system—increasing cost and integration effort.
- Focusing only on hardware while ignoring software and workflow: configuration, real-time monitoring, batch testing, report export, and protocol compatibility (openDAQ/ASIO, etc.) directly determine throughput.
What you should evaluate:
- Signal types to acquire: In selection, clearly defining your signal types is the first step. Acoustic/vibration measurements are very different from stress, temperature, and voltage measurements. Traditional systems often support only a subset of signal types—for example, only sound pressure and acceleration—so when the requirement expands to temperature, you may need a second system, which increases budget and adds integration/synchronization complexity. SonoDAQ uses a modular platform approach: by inserting the required signal-type modules, you can expand capability within one system and run synchronized multi-physics tests—configuring what you need in one platform.
- Channel count and scalability: First determine how many signals you need to acquire and choose a DAQ with enough analog input channels (or a system that can expand). It’s best to leave some margin for future points—for example, if you need 12 channels today, consider 16+ channels. Equally important is scalability: SonoDAQ can be synchronized across multiple units to scale to hundreds or even thousands of channels while maintaining inter-channel acquisition skew < 100 ns, which suits large-scale testing. By contrast, fixed-channel devices cannot be expanded once you exceed capacity, forcing a replacement and increasing cost.
- Match sampling rate to signal bandwidth: start with the highest frequency/bandwidth of interest. The baseline is Nyquist (sampling rate > 2× the highest frequency). In practice, you also need margin for the anti-aliasing filter transition band, so many projects start at 2.5–5× bandwidth and then fine-tune based on the analysis method (FFT, octave bands, order tracking, etc.). For example, if engine vibration content tops out at 1 kHz, you might start at 5.12 kS/s or higher; for speech/acoustics that needs to cover 20 kHz, common choices are 51.2 kS/s or 96 kS/s. In short: base it on the spectrum, keep some margin, and align it with your filtering and analysis.
- Measurement accuracy and dynamic range: If your application needs to resolve weak signals while also covering large signal swings—for example, NVH tests often need to capture very low noise in quiet conditions and also record high SPL under strong excitation—you need a high-dynamic-range, high-resolution DAQ (24-bit ADC or higher, dynamic range > 120 dB). For audio testing, where distortion and noise floor matter and you want the DAQ’s self-noise to be well below the DUT, choose a low-noise, high-SNR front end and check vendor specs such as THD+N.
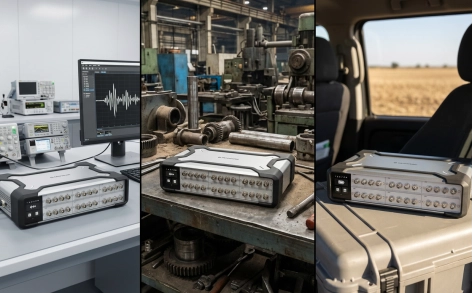
- Environment and use constraints: Think about where the DAQ will be used: on a lab bench, on the factory floor, or outdoors in the field. If you need to travel frequently or test on a vehicle, a portable/rugged DAQ is usually a better fit.For scenarios without stable power for long periods, built-in battery capability and battery runtime become critical.
- Lead time and after-sales support: After you define the procurement need, delivery lead time is a practical factor you can’t ignore. If your schedule is tight, a 2–3 month lead time can directly delay project kickoff and execution, so evaluate the supplier’s delivery commitment. Support is equally important: training, responsiveness when issues occur, and whether remote or on-site assistance is available. Also review warranty terms, software upgrade policy, and support response mechanisms—these directly affect long-term system stability and overall project efficiency.

With the above steps, you can narrow down the DAQ characteristics that fit your application and make a defensible choice from a crowded product list. In short: start from requirements, focus on the key specs, plan for future expansion, and don’t ignore vendor maturity and support. Choose the right tool, and testing becomes far more efficient.
FAQ
Q: Can I use a sound card as a DAQ?
A: For a small number of audio channels where synchronization/range/calibration requirements are not strict, a sound card can “work” at a basic level. But in engineering test work, common issues are: no IEPE excitation, insufficient input range and noise floor, uncontrolled channel-to-channel sync, and driver latency that is high and unstable. If you need repeatable, traceable test data, use a professional DAQ front end.
Q: What’s the difference between a DAQ and an oscilloscope?
A: An oscilloscope is more of an electronics debugging tool—great for capturing transients and doing quick troubleshooting. A DAQ is more of a long-duration, multi-channel, time-synchronized acquisition and analysis system, with an emphasis on channel scalability, synchronization consistency, long-term stability, and data management.
Q: How do I choose the sampling rate?
A: Start from the highest frequency/bandwidth of interest and meet Nyquist (>2× fmax) as a baseline. In practice, also account for the anti-aliasing filter transition band and your analysis method; starting at 2.5–5× bandwidth is usually safer. If you’re unsure, prioritize proper filtering and dynamic range first, then optimize sampling rate.
Q: What is IEPE, and when do I need it?
A: IEPE is a constant-current excitation scheme used by sensors such as accelerometers and IEPE measurement microphones, with power and signal on the same cable. If you use IEPE sensors, your DAQ front end must support IEPE excitation, appropriate isolation/grounding strategy, and suitable input range and bandwidth.
Q: What should I check for multi-channel / multi-device synchronization?
A: Focus on three things: a common clock source (external clock/PTP/GPS, etc.), channel-to-channel sampling skew/delay, and trigger/alignment strategy. For NVH, array measurements, and structural modal testing, sync performance often matters more than single-channel specs.
Q: How do I estimate channel count—and should I leave headroom?
A: List the “must-measure” signals and points first, then add auxiliary channels such as tach/trigger/temperature. A good rule is to reserve at least 20%–30% headroom, or choose a modular platform that scales, so you’re not forced to replace the system when points get added.
If you’d like to learn more about the latest intelligent sound & vibration data acquisition system, SonoDAQ, from CRYSOUND, including its key features, typical application scenarios, and common configuration options, please fill out the Get in touch form below to contact the CRYSOUND team.
You’re also welcome to reach out to the CRYSOUND team. Based on your constraints—such as signal types, channel count, sampling rate/bandwidth, synchronization requirements, and on-site environmental conditions—we can provide a product demo and practical configuration recommendations.
Under regulations such as the EU Machinery Noise Directive, more and more products—from toys and power tools to IT equipment—are required to declare their sound power level on labels and in documentation, rather than simply claiming they are “quiet enough.”
For typical office devices like notebook computers, idle noise is often around 30 dB(A), while full-load operation can approach 40 dB(A). These figures are usually obtained from sound power measurements performed in accordance with ISO 3744 and related standards.
Sound Pressure vs. Sound Power
A noise source emits sound power, while what we measure with a microphone is sound pressure.
Sound pressure varies with room size, reverberation, and microphone distance, whereas sound power is the source’s own “noise energy” and does not change with installation or environment. That makes sound power a better metric for external product noise specification.
In simple terms:
- Sound power is the cause – the energy emitted by the source (unit: W / dB);
- Sound pressure is the effect – the sound pressure level we hear and measure (unit: Pa / dB).
ISO 3744 defines how to do this in an “essentially free field over a reflecting plane”: arrange microphones around the source on an enveloping measurement surface, measure the sound pressure levels on that surface, then apply specified corrections and calculations to obtain stable, comparable sound power levels.
Device Under Test: An Everyday Notebook Computer
Assume our DUT is a 17-inch office notebook. The goal is to determine its A-weighted sound power level under different operating conditions (idle, office load, full load), in order to:
- Compare different cooling designs and fan control strategies;
- Provide standardized data for product documentation or compliance;
- Supply baseline data for sound quality engineering (for example, whether the fan noise is annoying).
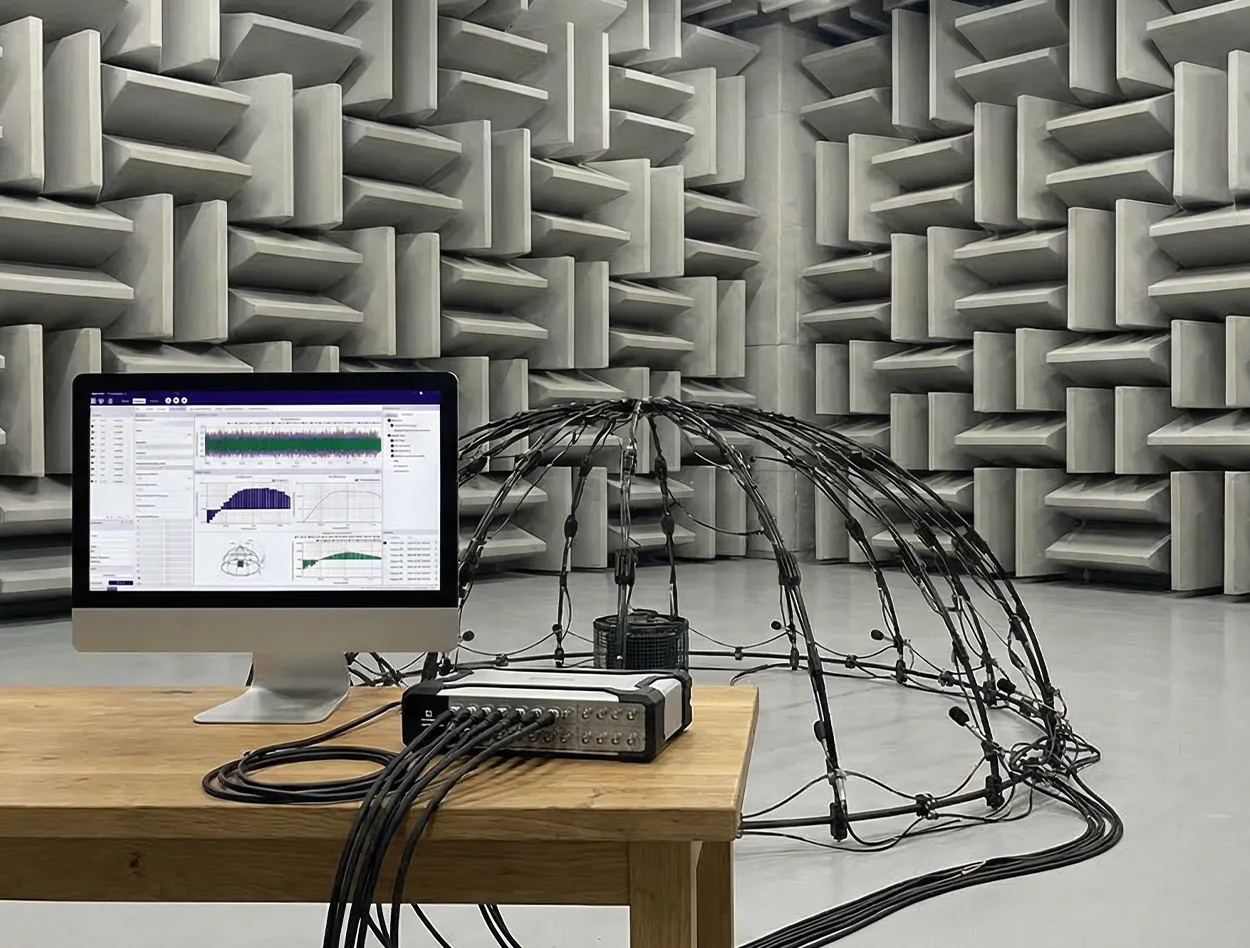
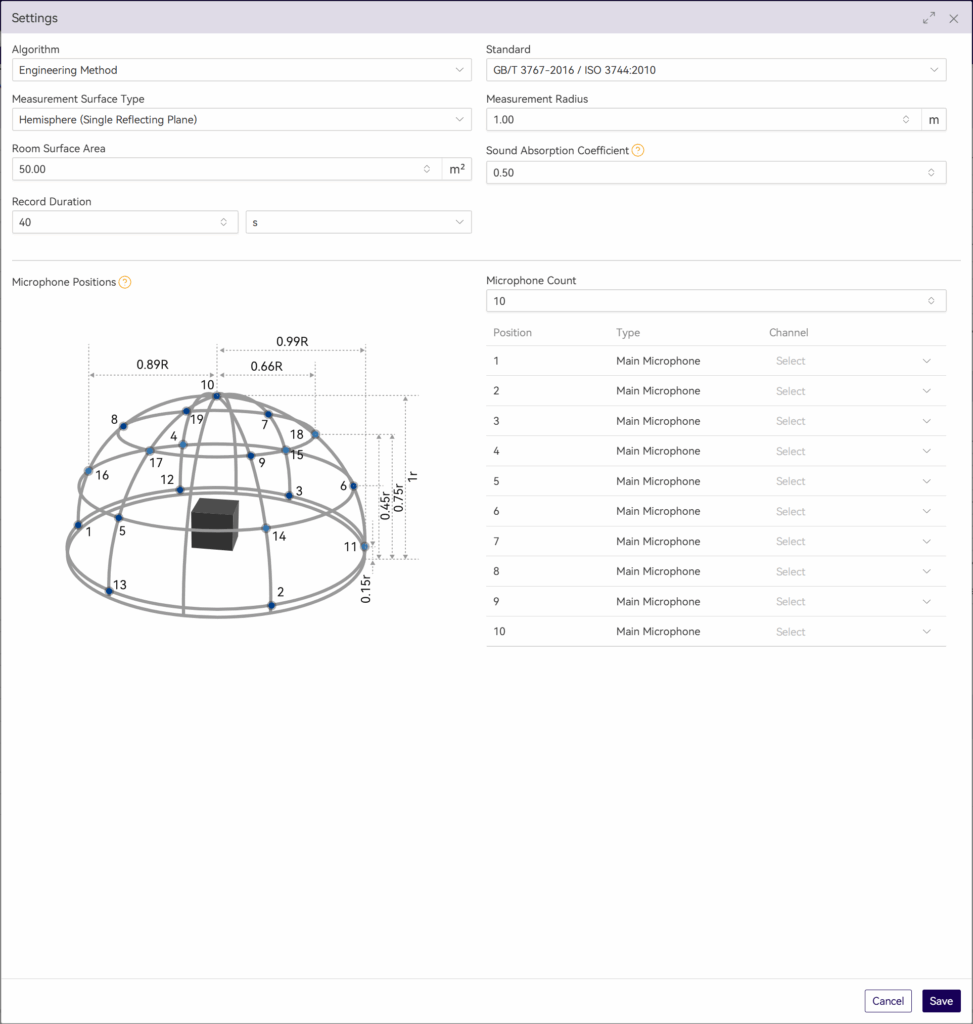
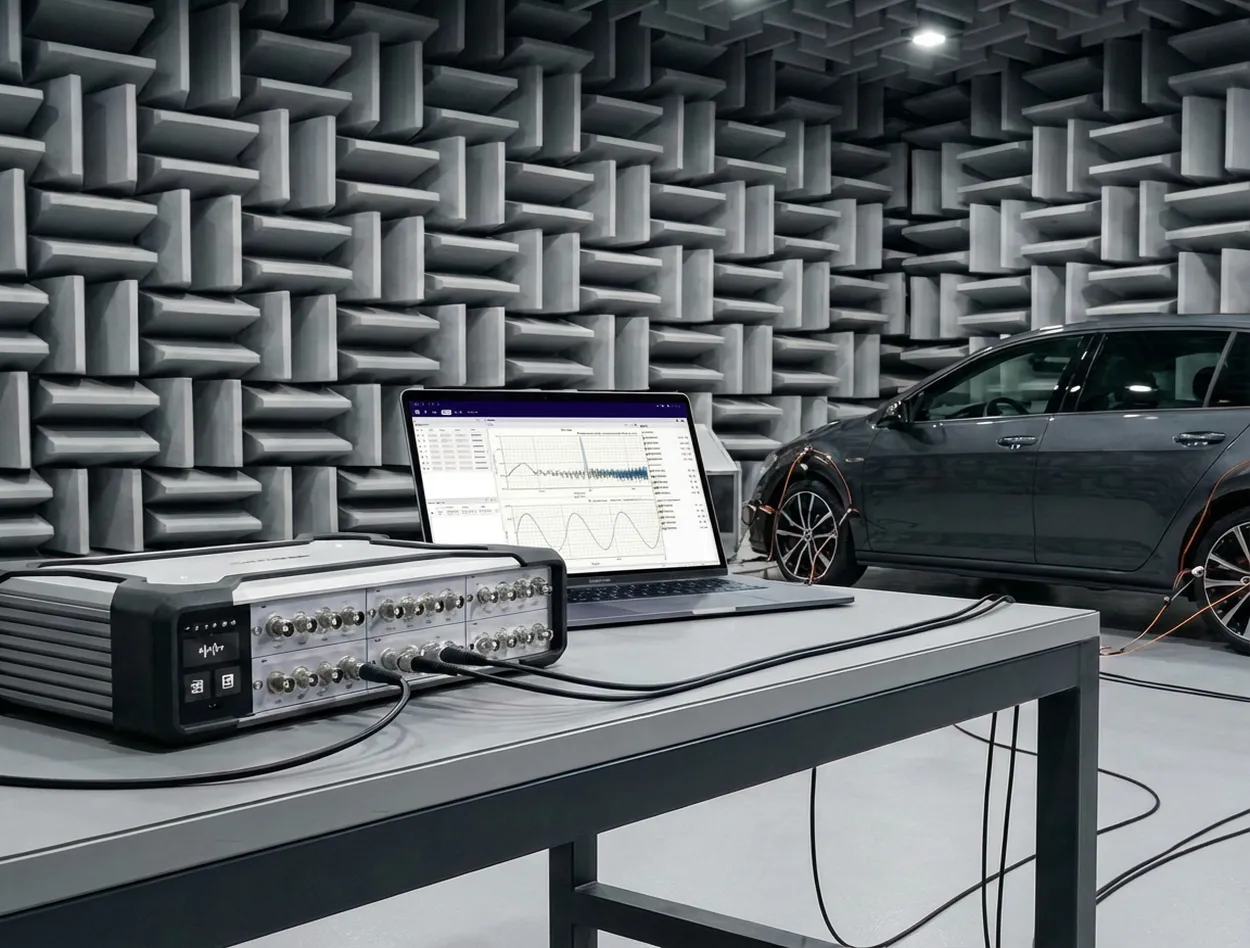
The test environment is a semi-anechoic room with a reflecting floor. The notebook is placed on the reflective plane, and multiple microphone positions are arranged around it (using a hemispherical frame or a regular grid). Overall, the setup satisfies ISO 3744 requirements for the measurement surface and environment.
Measurement System: SonoDAQ Pro + OpenTest Sound Power Module
On the hardware side, we use SonoDAQ Pro together with measurement microphones, arranged around the notebook according to the standard.
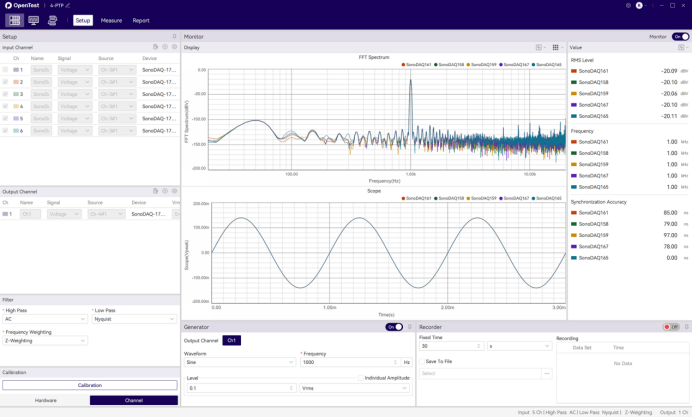
OpenTest connects to SonoDAQ via the openDAQ protocol. In the channel setup interface, you select the channels to be used and configure parameters such as sensitivity and sampling rate.
From Standard to Platform: Why Use OpenTest for Sound Power?
OpenTest is CRYSOUND’s next-generation platform for acoustic and vibration testing. It supports three modes—Measure, Analysis, and Sequence—covering both R&D laboratories and repetitive production testing.
For sound power applications, OpenTest implements a sound-pressure-based solution fully compliant with ISO 3744 (engineering method), and also covering ISO 3745 (precision method) and ISO 3746 (survey method). You can flexibly select the test grade according to the test environment and accuracy requirements. The platform includes dedicated sound power report templates that generate standards-compliant reports directly, avoiding repeated manual work in Excel.
On the hardware side, OpenTest connects to multi-brand DAQ devices via openDAQ, ASIO, WASAPI, and NI-DAQmx, enabling unified management of CRYSOUND SonoDAQ, RME, NI and other systems. From a few channels for verification to large microphone arrays, everything can be handled within a single software platform.
Three Steps: Running a Standardized ISO 3744 Sound Power Workflow
Step 1: Parameter Setup and Environment Preparation
After creating a new project in OpenTest:
- In the channel setup view, select the microphone channels to be used and configure sensitivity, sampling rate, frequency weighting, and other parameters.
- Switch to Measure > Sound Power and set the measurement parameters:
- Test method and measurement-surface-related parameters;
- Microphone position layout;
- Measurement time;
- Other parameters corresponding to ISO 3744.
This step effectively turns the standard’s clauses into a reusable OpenTest scenario template.
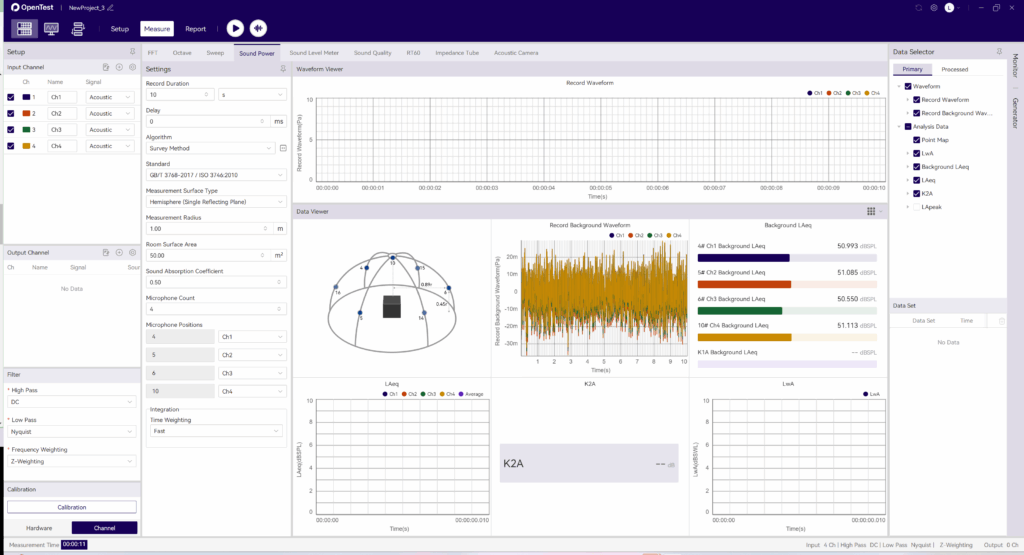
Step 2: Measure Background Noise First, Then Operating Noise
According to ISO 3744, you must measure sound pressure levels on the same measurement surface with the device switched off and device running, in order to perform background noise corrections.
In OpenTest, this is implemented as two clear operations:
- Acquire background noise
Click the background-noise acquisition icon in the toolbar. OpenTest records ambient noise for the preset duration.- In the survey method, OpenTest updates LAeq for each channel once per second;In the engineering and precision methods, it updates the LAeq of each 1/3-octave band once per second.
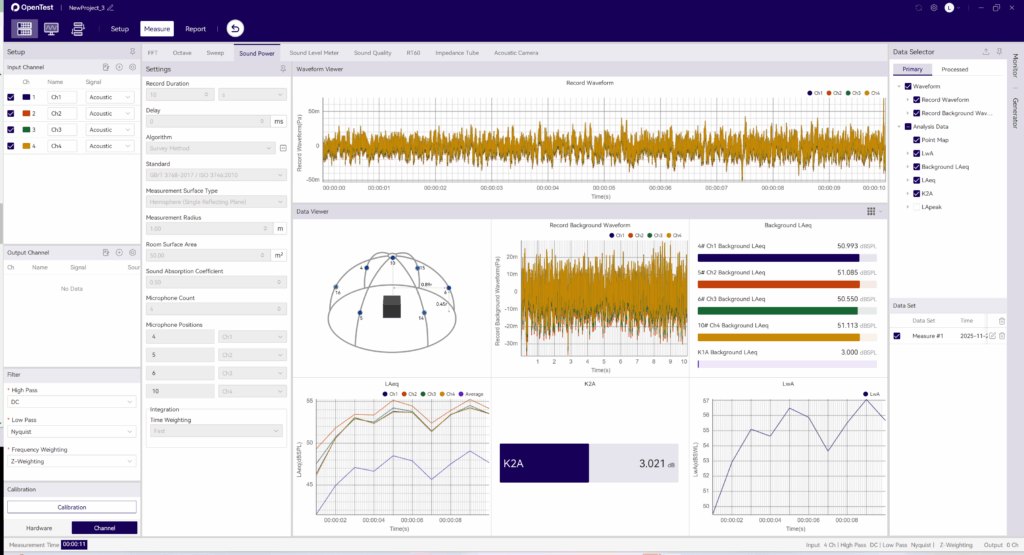
- Acquire operating noise
After background acquisition, click the Test icon. OpenTest will:
a. Record notebook operating noise for the preset duration;
b. Update real-time sound pressure levels once per second;
c. Automatically store the run as a data set for later replay and comparison.
Step 3: From Multiple Measurements to One Standardized Report
After completing multiple operating conditions (for example: idle, typical office work, full-load stress):
- In the data set view, select the records you want to compare and overlay them to observe sound power differences under different conditions;
- In the Data Selector, click the save icon to export the corresponding waveform files and CSV data tables for further processing or archiving;
- Click Report in the toolbar, fill in project and device information, select the data sets to include, adjust charts and tables, and export an Excel report with one click.
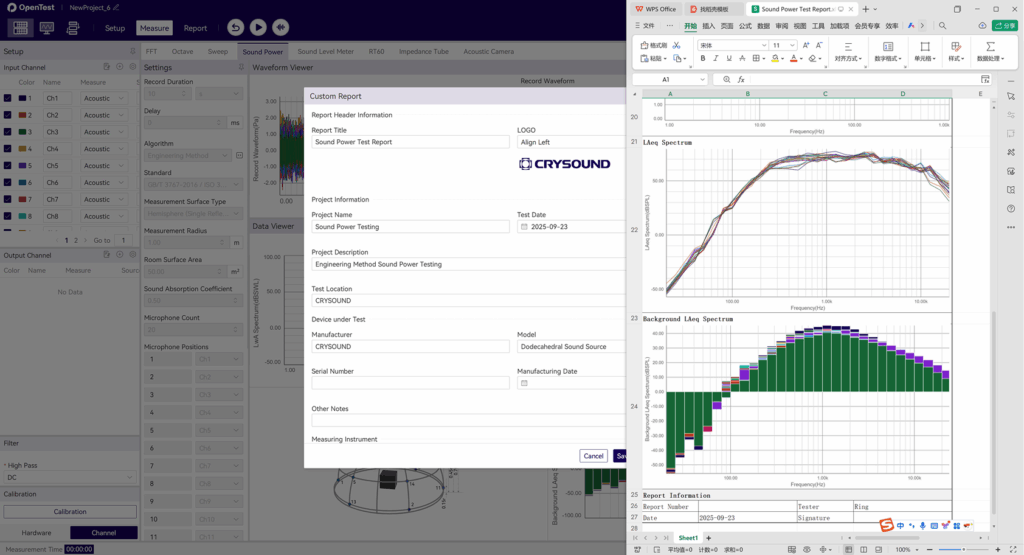
The report includes measurement conditions, measurement surface, band or A-weighted sound power levels, background corrections, and other key information. It can be used directly for internal review or regulatory/customer submissions, following the same idea as other standardized sound power reporting solutions.
From a Single Notebook Test to a Reusable Sound Power Platform
Running an ISO 3744 sound power test on a notebook is just one example. More importantly:
- The standardized OpenTest scenario can be cloned for printers, home appliances, power tools, and many other products;
- Multi-channel microphone arrays and SonoDAQ hardware can be reused across projects within the same platform;
- The test workflow and report format are “locked in” by the software, making it easier to hand over, review, and audit across teams.
If you are building or upgrading sound power testing capability, consider using ISO 3744 as the backbone and OpenTest as the platform that links environment, acquisition, analysis, and reporting into a repeatable chain—so each test is clearly traceable and more easily transformed from a one-off experiment into a lasting engineering asset.
Visit www.opentest.com to learn more about OpenTest features and hardware solutions, or contact the CRYSOUND team by filling out the “Get in touch” form below.
SonoDAQ is the next-generation high-performance data acquisition system, specifically designed for sound and vibration testing. It features a modular architecture, making data acquisition more efficient and precise. From industrial environments to laboratory measurements, SonoDAQ meets the demands of high-precision data acquisition and provides seamless support for multi-channel synchronized data collection.
Modular Design, Flexible to Adapt to Various Applications
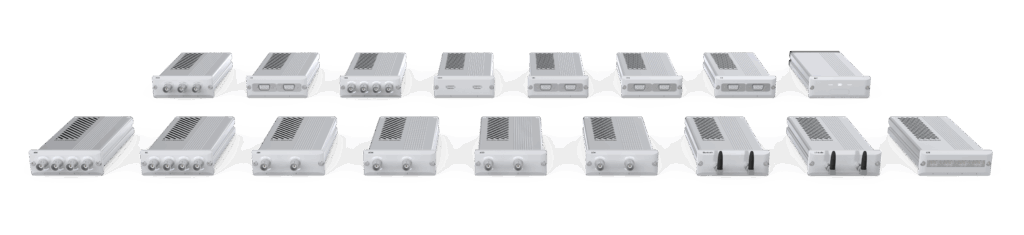
SonoDAQ adopts a completely new modular design, allowing for flexible configuration based on different needs. Whether you require a basic 4-channel setup or a large-scale system with hundreds of channels, SonoDAQ can easily accommodate both. You can select modules according to your project requirements and expand the system at any time, avoiding unnecessary costs. This flexibility is particularly well-suited for dynamic and evolving testing environments.
High-Precision Synchronization Ensures the Accuracy of Test Results
In sound and vibration testing, data accuracy is crucial. SonoDAQ is equipped with a 32-bit ADC and a sampling rate of up to 204.8 kHz. It ensures time synchronization between channels with a time error of less than 100 ns through PTP (IEEE 1588) and GPS synchronization. This level of synchronization precision allows you to obtain reliable and consistent data results, even in multi-channel, large-scale distributed acquisition systems.

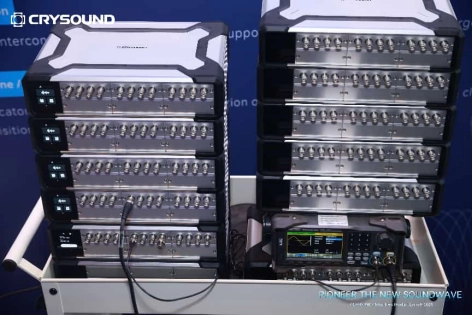
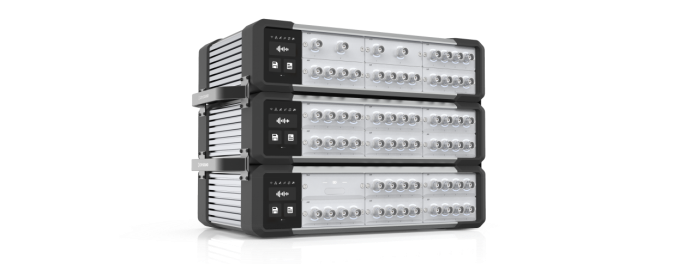
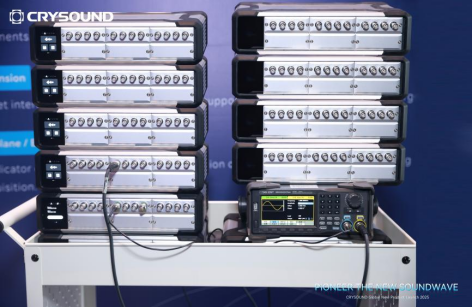
Flexible System Expansion with Multiple Network Topologies
Another highlight of SonoDAQ is its powerful distributed acquisition capability. With various network connection methods like daisy chain and star topology, multiple devices can be easily integrated into the same acquisition system. Leveraging PTP (Precision Time Protocol) and GPS synchronization technology, SonoDAQ ensures nanosecond-level synchronization, providing data consistency across devices, whether for small-scale laboratory tests or large-scale field data collection. You can choose different system topologies based on your specific needs, offering flexibility for complex testing scenarios.
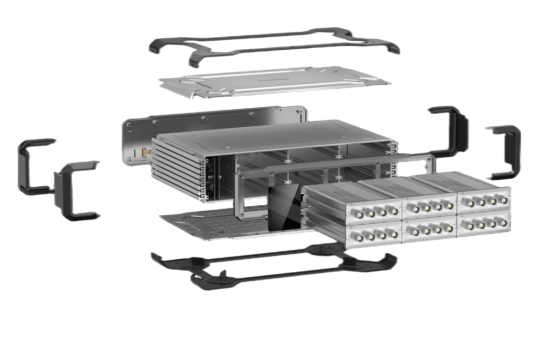
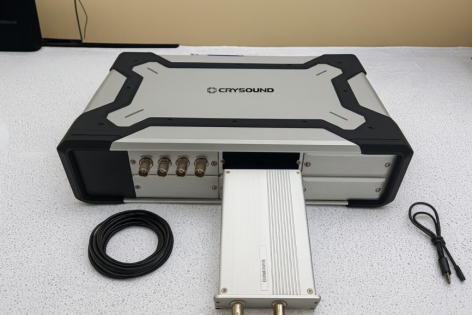
Innovative Structural Design, the Ideal Choice for Field Applications
SonoDAQ’s frame is made using 5000t aluminum extrusion technology combined with carbon fiber-reinforced plastic, offering exceptional sturdiness while significantly reducing the device’s weight. Additionally, SonoDAQ supports PoE power supply and hot-swappable batteries, ensuring efficient operation even in harsh environments and meeting the demands of long-duration continuous acquisition. Whether in the laboratory or on industrial sites, SonoDAQ delivers stable performance.
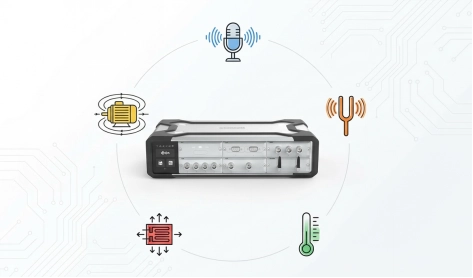
Extensive Signal Compatibility, Expanding Your Testing Boundaries
SonoDAQ supports a variety of signal inputs, including IEPE sensors, CAN bus, digital I/O, and other interface protocols. This allows it to meet a wide range of testing needs, from vibration monitoring to motor noise analysis. Whether you’re conducting basic data acquisition or advanced signal analysis, SonoDAQ provides the precision and flexibility you require.
Enhance Testing Efficiency, Making Data Acquisition Simpler
With the accompanying OpenTest software, SonoDAQ allows you to monitor and analyze collected signals in real-time. OpenTest offers an intuitive interface and powerful data analysis features, making it easier to process and present test data. Additionally, SonoDAQ supports open protocols like ASIO and OpenDAQ, facilitating integration with other testing tools or software.
SonoDAQ will help streamline your testing process, improve data acquisition efficiency, and provide precise measurements in various complex testing environments. Whether it’s noise testing, vibration analysis, or complex sound power measurements, SonoDAQ is your ideal choice. Choose SonoDAQ today and bring revolutionary changes to your testing work!
SonoDAQ is ready to transform your testing process — don’t wait to experience its power. Contact us now! Please fill out the ‘Get in touch’ form below, and we’ll get back to you shortly!
In sound and vibration testing, flexibility is a decisive factor—especially when test requirements evolve rapidly. SonoDAQ, with its modular, scalable architecture, helps users easily manage everything from simple tests with a single device to complex, large-scale, multi-channel data acquisition. Whether in laboratory environments or industrial sites, SonoDAQ provides efficient, accurate data acquisition solutions, maximizing the adaptability and scalability of the system.
Easy Testing with One Device, Scalable Expansion with Multiple Devices
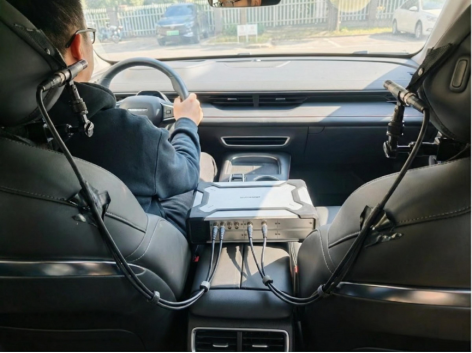
When testing requirements are modest, such as road tests or basic vibration testing, SonoDAQ Pro can easily meet the required number of channels with a single device. In this case, users only need one device to perform high-precision data acquisition, which is efficient and helps avoid unnecessary upfront hardware investment.
However, as testing needs increase, especially in scenarios that require numerous sensors or synchronized multi-channel acquisition, SonoDAQ offers flexible expansion solutions. Users can connect multiple SonoDAQ Pro units in a daisy-chain or star topology to achieve large-scale data acquisition. For example, when conducting NVH testing or sound and vibration testing for large equipment, users can add more devices as needed, scaling up to hundreds of channels while ensuring high-precision synchronization across all devices.
This scalability allows customers to avoid purchasing entirely new acquisition systems each time. By simply cascading existing SonoDAQ Pro units, they can easily cover more complex testing needs and avoid the common issues of device redundancy and high costs seen in traditional systems.
Flexible Configuration to Meet Various Needs
Even without large-scale acquisition needs, SonoDAQ remains highly flexible. With its modular design, users can easily adjust and reconfigure the system according to changing test requirements. For instance, if only temperature or strain signals are required, users can simply select the corresponding module and insert it into the chassis, without purchasing a new mainframe.
This design makes SonoDAQ suitable for everything from simple laboratory tests to complex field tests. Users can expand the system as needed, without worrying about future expansion limits. Whether it’s basic data acquisition or advanced signal analysis, SonoDAQ provides accurate, flexible data acquisition solutions, significantly enhancing testing efficiency and cost-effectiveness.
Flexibility Brought by Modular Design
The modular design of SonoDAQ is the core of its flexibility. Users can select different input modules, output modules, sensor interface modules, and more based on project requirements, and easily plug-and-play or upgrade them as needed. Whether it’s adding more sensor channels or expanding with new functional modules, users can quickly implement changes by swapping modules, without affecting the normal operation of the existing system. This design ensures long-term device usability and enables SonoDAQ to adapt to ever-changing test requirements.
When future requirements change, such as testing additional signal types (e.g., temperature, pressure, strain), SonoDAQ Pro can easily meet these new testing needs by simply swapping modules, allowing the overall system to continue running efficiently without the need for a full system overhaul.
For example, an automotive manufacturer needs to perform NVH testing. Initially, they may only need 4–8 channels for in-car noise testing. In this case, engineers can use a single SonoDAQ Pro device to complete routine testing tasks. When they need to expand the testing scope and add more sensors (such as measuring vibration, strain, or temperature at different locations), they can simply daisy-chain multiple SonoDAQ Pro devices together. Through synchronization technology, they can ensure data consistency across all devices without redesigning the system or changing existing test procedures.
Beyond automotive NVH, the same scalable architecture can be applied to aerospace components, industrial machinery, and even high-channel-count consumer electronics testing.
Expand as Needed, Effortlessly Tackle Any Testing Challenge
The flexible expansion capability of SonoDAQ allows it to scale from simple single-channel testing to large-scale multi-channel data acquisition. Whether it’s for in-vehicle testing, industrial monitoring, or scientific research, SonoDAQ provides accurate, reliable data acquisition solutions. Its modular design and flexible system topology not only meet current needs but also enable quick adaptation to evolving testing scenarios in the future. Choosing SonoDAQ means moving away from fixed hardware configurations and instead adjusting the system based on needs, ensuring smooth, repeatable execution of every test.
SonoDAQ is ready to transform your testing process—from simple single-device setups to large-scale, multi-channel systems. Contact us now: fill out the “Get in touch” form below, and our team will get back to you shortly.