What Is a Data Acquisition System? DAQ Types, Key Specs & Selection Guide

Table of content


    A complete engineer’s guide to DAQ systems: PCIe/PXI cards, USB/Ethernet recorders, modular multi-channel systems. Covers dynamic range, PTP sync, IEPE, and how to select the right DAQ for NVH, vibration & acoustic testing.

    A data acquisition system (DAQ) is the measurement front end: it converts analog sensor outputs—such as voltage, current, and charge—into digital data. The signal is first conditioned (amplification, filtering, isolation, IEPE excitation, etc.) and then fed to an ADC, where it is digitized at the specified sampling rate and resolution; software subsequently handles visualization, storage, and analysis. This article systematically reviews common DAQ form factors, including PCIe/PXI plug-in cards, external USB/Ethernet/Thunderbolt devices, integrated data recorders, and modular distributed systems. It also summarizes key selection criteria—signal compatibility, channel headroom and scalability, sampling rate and anti-aliasing filtering, dynamic range, THD+N, clock synchronization and inter-channel delay, as well as delivery and after-sales support—to help readers quickly build a clear understanding of DAQ systems.

    Why Data Acquisition Matters?

    In the real world, physical stimuli such as temperature, sound, and vibration are everywhere. We can sense them directly; in a sense, the human body itself is a “data acquisition system”: our senses act like sensors that capture signals, the nervous system handles transmission and encoding, the brain fuses and analyzes the information to make decisions, and muscles execute actions—forming a closed feedback loop.

    Progress in science and engineering ultimately comes from observing, understanding, and validating the world with more reliable methods. Physical quantities such as temperature, sound pressure, vibration, stress, and voltage are the primary carriers of information. However, human perception is subjective and cannot quantify these changes accurately and repeatably; and in high-current, high-temperature, high-stress, or high-SPL environments, direct exposure can even cause irreversible harm. To enable measurement that is quantifiable, recordable, and safer, data acquisition systems (DAQ) came into being.

    Put simply, a data acquisition system (DAQ) is an analog front end that converts a sensor's analog output (voltage/current/charge, etc.) into digital data at a defined sampling rate and resolution, and hands it to software for display, logging, and analysis (typically with the required signal conditioning). It helps engineers see problems more clearly—and solve them.

    In today's development cycles—from cars and aircraft to consumer electronics—it's difficult to validate performance, safety, and reliability efficiently without data acquisition. In durability testing, DAQ records cyclic load and strain for fatigue-life analysis; in noise control, synchronous multi-point acquisition of vibration and sound pressure helps identify noise sources and transmission paths. This quantitative capability is what provides a scientific basis for engineering improvements.

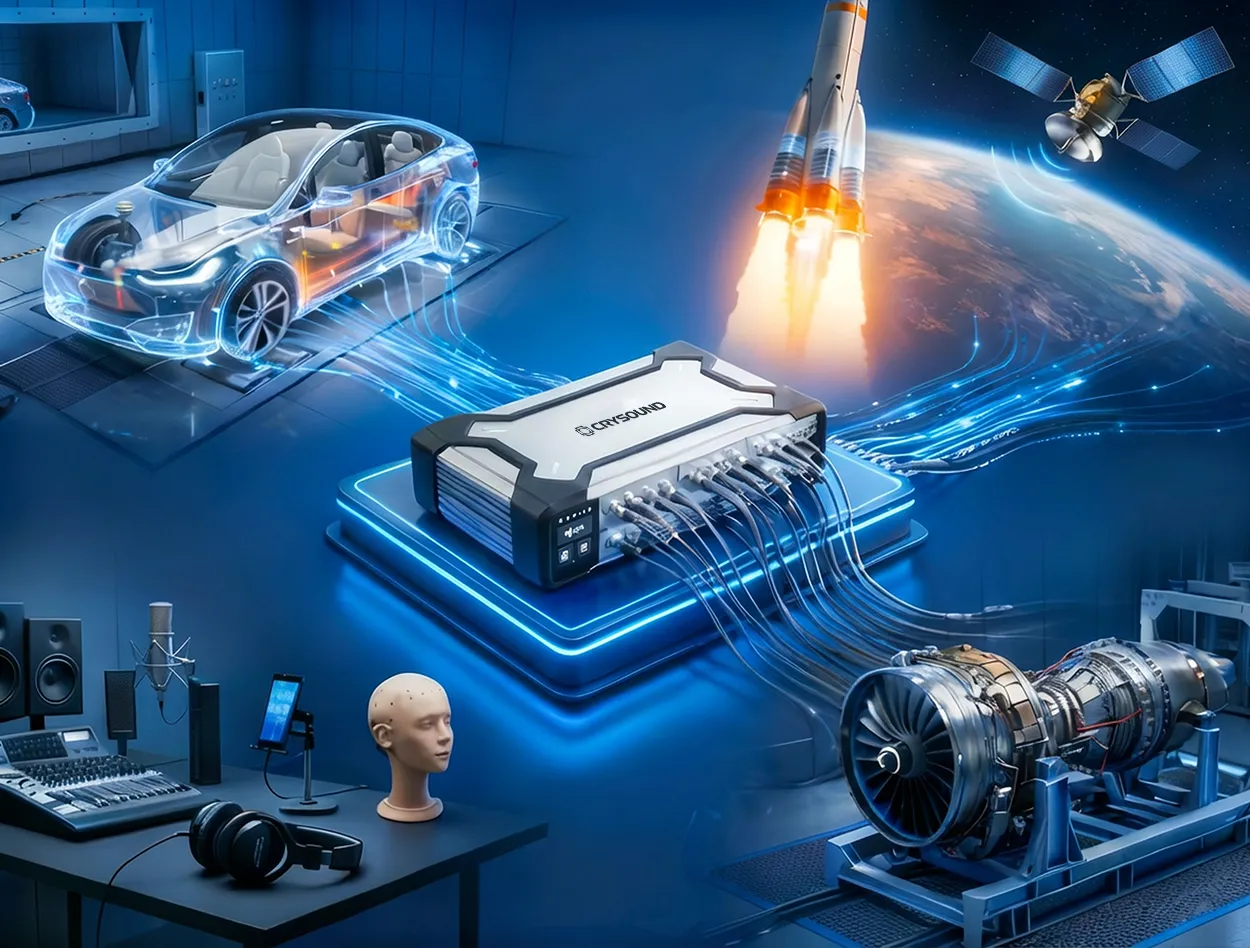
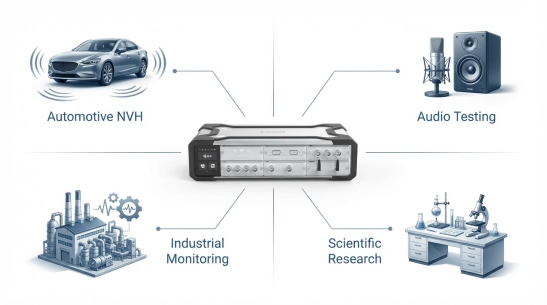
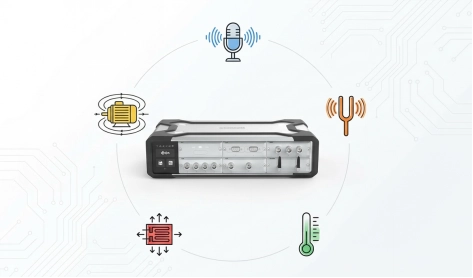
    DAQ applications span a wide range of fields:

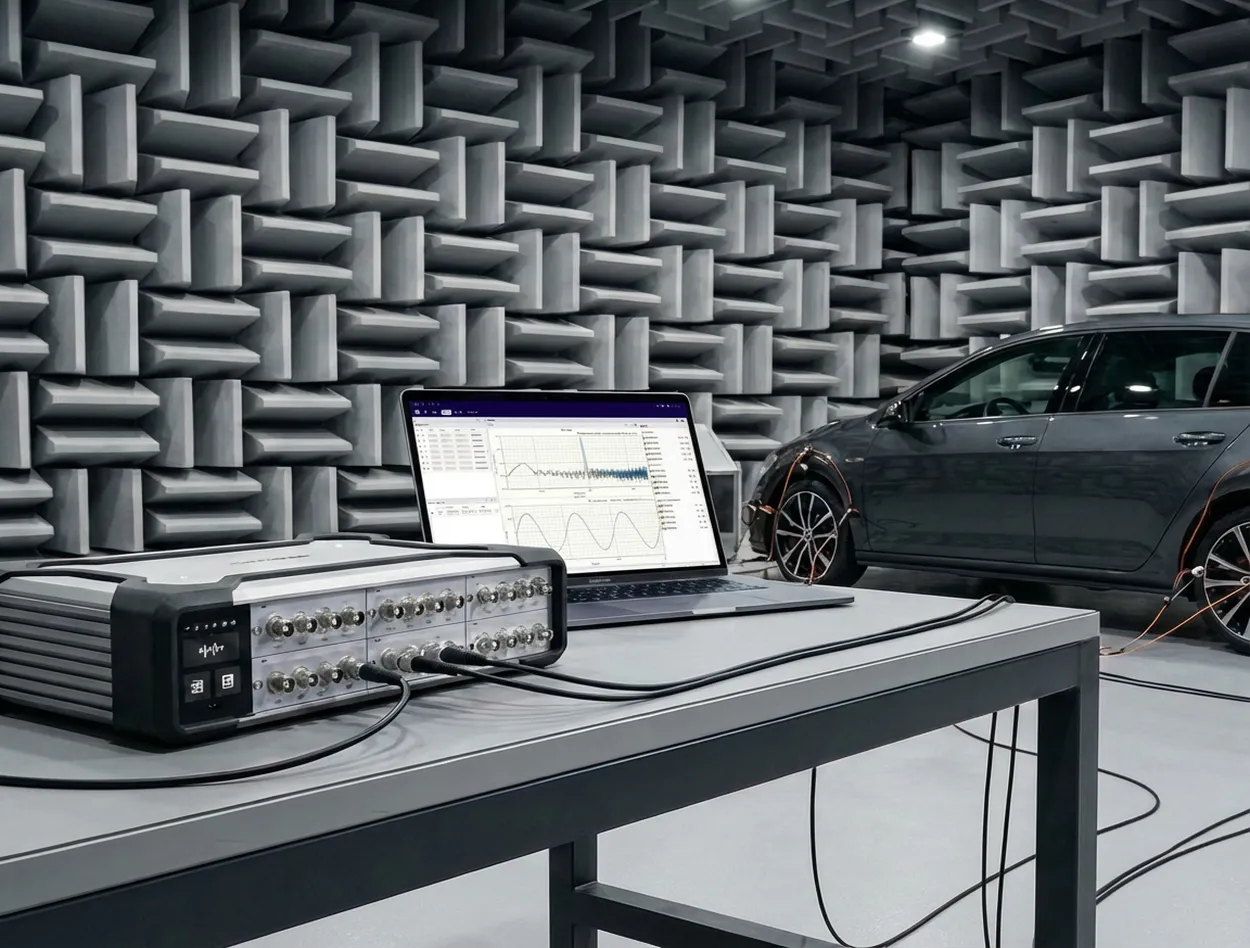
    • Automotive NVH and mechanical vibration testing: Used to acquire body vibration, noise, engine balance, structural modal data, and more—helping engineers improve vehicle ride comfort.
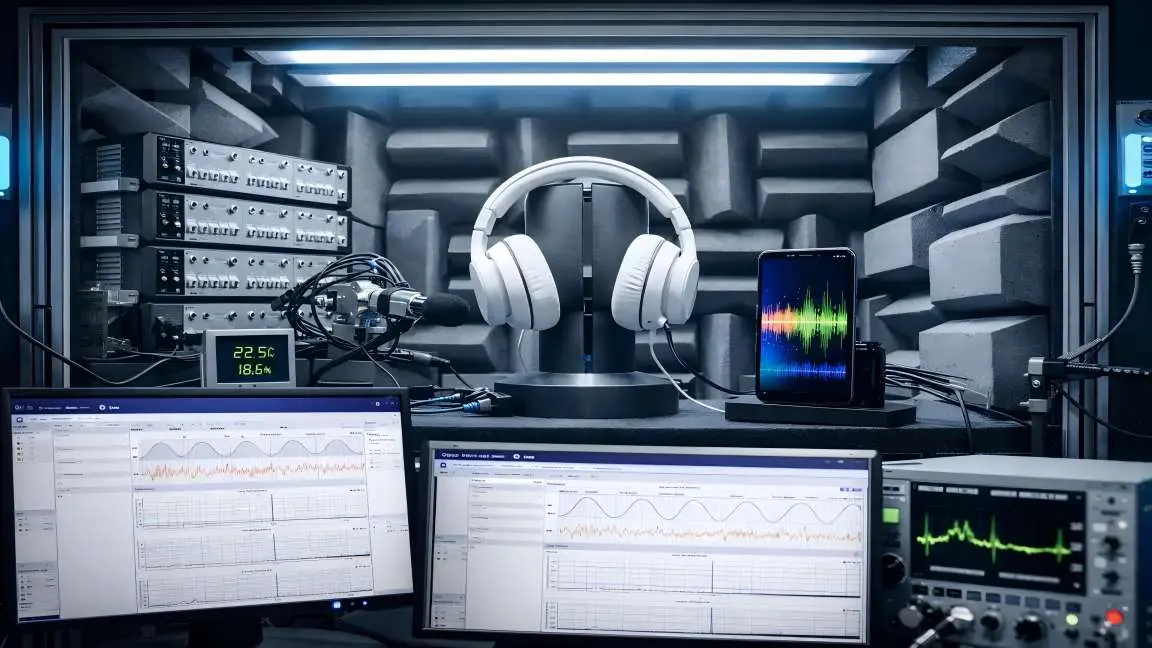
    • Audio testing: In the development and production of speakers, microphones, headphones, and other audio devices, DAQ is used to measure frequency response, SPL, distortion, and more, to verify acoustic performance.
    • Industrial automation and monitoring: DAQ is widely used for process monitoring, condition monitoring, and industrial control. For example, it acquires temperature, pressure, flow, and torque sensor signals to enable real-time monitoring and alarms, and it often must run continuously with high stability and strong immunity to interference.
    • Research labs and education: From physics and biology experiments to seismic monitoring and weather observation, DAQ is a basic tool for capturing raw data. It makes data recording automated and digital, which simplifies downstream processing.

    As quality and performance requirements continue to rise across industries, DAQ has become an indispensable set of “eyes and ears,” giving engineers the ability to observe and interpret complex phenomena.

    Common DAQ Form Factors

    Depending on interface, level of integration, and the application, DAQ hardware comes in several common forms. Below are a few typical DAQ card/system categories:

    TypeForm factor / InterfaceAdvantagesLimitationsTypical Application
    Plug-in DAQ cardPCIe / PXI / PXIeLow latency; high throughput; strong real-time performanceNot portable; requires chassis/industrial PC; expansion limited by platformFixed labs; rack systems; high-throughput acquisition
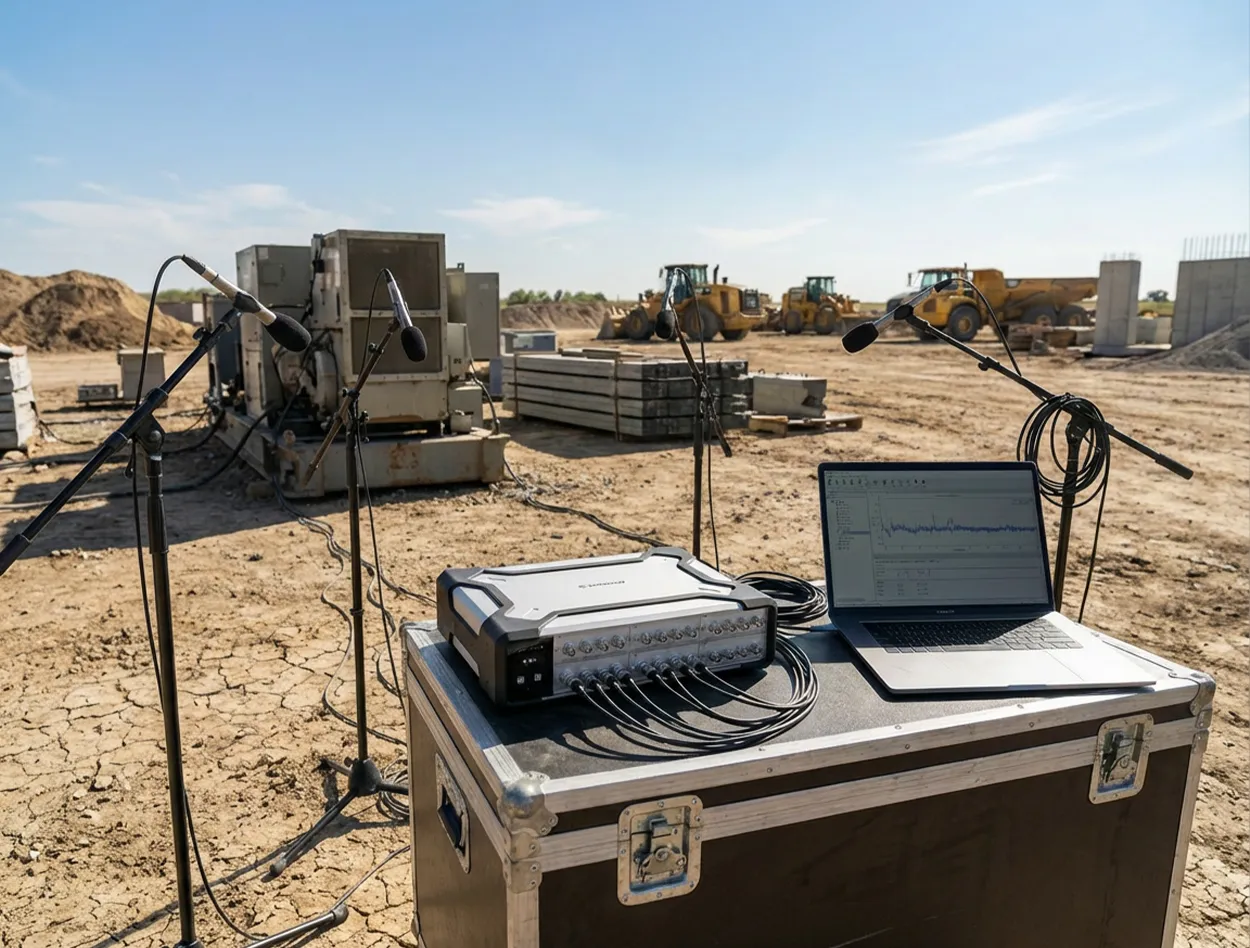
    External DAQ deviceUSB / Ethernet / ThunderboltPortable; fast setup; laptop-friendlyBandwidth/latency depends on interface; driver stability is critical; mind power and cablingField testing; mobile measurements; general-purpose DAQ
    Integrated data recorderBuilt-in battery/storage/display (standalone)Ready out of the box; easy in the field; straightforward offline loggingChannel count/algorithms often limited; weaker expandability; post-processing depends on exportPatrol inspection; quick diagnostics; long-duration offline logging
    Modular distributed systemMainframe + modules; network expansion (synchronized)Mix signal types as needed; easy channel scaling; strong synchronizationPlanning matters: sync/clock/cabling; system design becomes more important at scaleSynchronized Multi-Physics Measurement;High-Channel-Count Scalability;Distributed, Multi-Site Testing
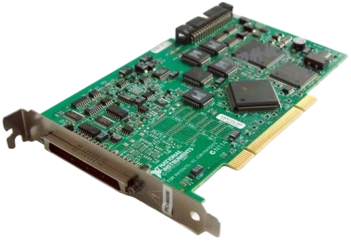
    • Plug-in DAQ cards (internal): These are boards installed inside a computer, with typical interfaces such as PCI, PCIe, and PXI (CompactPCI). They plug directly into the PC/chassis bus and are powered and controlled by the host, providing high bandwidth and strong real-time performance for high-throughput applications in desktop or industrial PC environments. The trade-off is portability—these are usually used in fixed labs or rack systems.
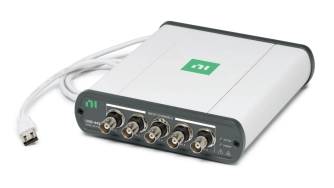
    • External DAQ devices (modules): DAQ hardware that connects to a computer via USB, Ethernet, Thunderbolt, and similar interfaces. USB DAQ is common—compact, plug-and-play, and well-suited to laptops and field testing. Ethernet/network DAQ enables longer cable runs and multi-device connections. External units are generally portable with their own enclosure, but high-end models may be somewhat limited in real-time performance by interface bandwidth (USB latency is typically higher than PCIe).
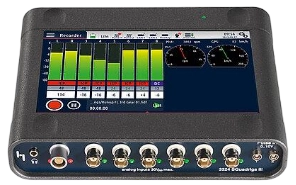
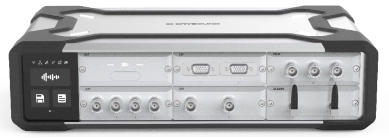
    • Portable / integrated data recorders: These integrate the DAQ hardware with an embedded computer, display, and storage to form a standalone instrument. They're convenient in the field and can acquire, log, and do basic analysis without an external PC. Examples include portable vibration acquisition/analyzer units with tablet-style displays and handheld multi-channel recorders. They are typically optimized for specific applications, ready to use out of the box, and well-suited for mobile measurements or quick on-site diagnostics.
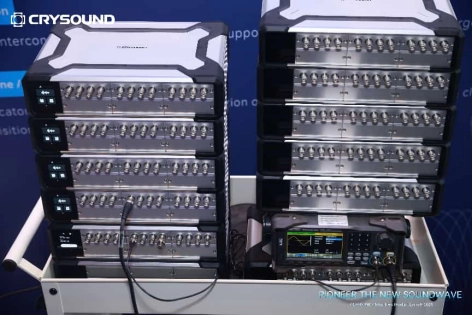
    • Modular distributed DAQ system platform: Built from multiple acquisition modules and a main controller/chassis, allowing flexible channel scaling and mixing of different function modules. Each module handles a certain signal type or channel count and connects to the controller (or directly to a PC) over a high-speed, time-synchronized network (e.g., EtherCAT, Ethernet/PTP). This architecture offers very high scalability and distributed measurement capability; modules can be placed close to the test article to reduce sensor cabling. For example, CRYSOUND's SonoDAQ is a modular platform: each mainframe supports multiple modules and can be expanded via daisy-chain or star topology to thousands of channels. Modular systems are a strong fit for large-scale, cross-area synchronized measurement.

    What Makes Up a DAQ System?

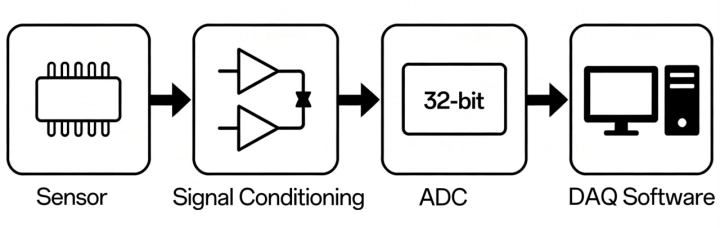
    A complete data acquisition system typically includes the following key building blocks:

    • Sensors: The front end that converts physical phenomena into electrical signals—for example, microphones that convert sound pressure to voltage, accelerometers that convert acceleration to charge/voltage, strain gauges that convert force to resistance change, and thermocouples for temperature measurement;
    • Signal conditioning: Electronics between the sensor and the DAQ ADC that adapts and optimizes the signal.Typical functions include gain/attenuation (scaling signal amplitude into the ADC input range), filtering (e.g., anti-aliasing low-pass filtering to remove noise/high-frequency content), isolation (signal/power isolation for noise reduction and protection), and sensor excitation (providing power to active sensors, such as constant-current sources for IEPE sensors).
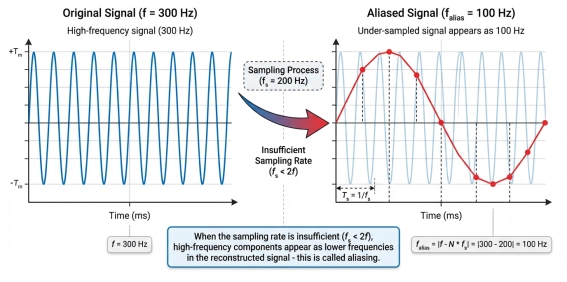
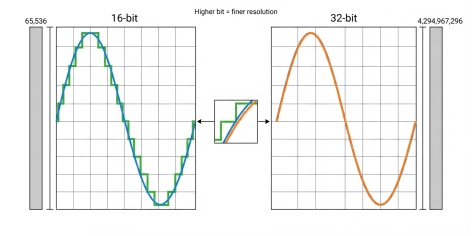
    • Analog-to-digital converter (ADC): The core component that converts continuous analog signals into discrete digital samples at the configured sampling rate and resolution. Sampling rate sets the usable bandwidth (it must satisfy Nyquist and include margin for the anti-aliasing filter transition band), while resolution (bit depth) affects quantization step size and usable dynamic range. Many DAQ products use 16-bit or 24-bit ADCs; in high-dynamic-range acoustic/vibration front ends (such as platforms like SonoDAQ), you may also see 32-bit data output/processing paths to better cover wide ranges and weak signals (depending on the specific implementation and how the specs are defined).
    • Data interface and storage: The ADC's digital data must be delivered to a computer or storage media. Plug-in DAQ writes directly into host memory over the system bus. USB/Ethernet DAQ streams data to PC software through a driver. In addition to USB/Ethernet/wireless data transfer, SonoDAQ also supports real-time logging to an onboard SD card, allowing standalone recording without a PC—useful as protection against link interruptions or for long-duration unattended acquisition.
    • Host PC and software: This is the back end of a DAQ system. Most modern DAQ relies on a computer and software for visualization, logging, and analysis. Acquisition software sets sampling parameters, controls the measurement, displays waveforms in real time, and processes data for results and reporting. Different vendors provide their own platforms (e.g., OpenTest, NI LabVIEW/DAQmx, DewesoftX, HBK BK Connect). Software usability and capability directly impact productivity. In addition, CRYSOUND's OpenTest supports protocols such as openDAQ and ASIO, enabling configuration with multiple DAQ systems.

    What Specs Matter When Selecting a DAQ?

    Three common selection pitfalls:

    • Focusing only on “sampling rate / bit depth” while ignoring front-end noise, range matching, anti-aliasing filtering, and synchronization metrics: the data may “look like it's there,” but the analysis is unstable and not repeatable.
    • Sizing channel count to “just enough” with no headroom: once you add measurement points, you're forced to replace the whole system or stack a second system—increasing cost and integration effort.
    • Focusing only on hardware while ignoring software and workflow: configuration, real-time monitoring, batch testing, report export, and protocol compatibility (openDAQ/ASIO, etc.) directly determine throughput.

    What you should evaluate:

    • Signal types to acquire: In selection, clearly defining your signal types is the first step. Acoustic/vibration measurements are very different from stress, temperature, and voltage measurements. Traditional systems often support only a subset of signal types—for example, only sound pressure and acceleration—so when the requirement expands to temperature, you may need a second system, which increases budget and adds integration/synchronization complexity. SonoDAQ uses a modular platform approach: by inserting the required signal-type modules, you can expand capability within one system and run synchronized multi-physics tests—configuring what you need in one platform.
    • Channel count and scalability: First determine how many signals you need to acquire and choose a DAQ with enough analog input channels (or a system that can expand). It's best to leave some margin for future points—for example, if you need 12 channels today, consider 16+ channels. Equally important is scalability: SonoDAQ can be synchronized across multiple units to scale to hundreds or even thousands of channels while maintaining inter-channel acquisition skew < 100 ns, which suits large-scale testing. By contrast, fixed-channel devices cannot be expanded once you exceed capacity, forcing a replacement and increasing cost.
    • Match sampling rate to signal bandwidth: start with the highest frequency/bandwidth of interest. The baseline is Nyquist (sampling rate > 2× the highest frequency). In practice, you also need margin for the anti-aliasing filter transition band, so many projects start at 2.5–5× bandwidth and then fine-tune based on the analysis method (FFT, octave bands, order tracking, etc.). For example, if engine vibration content tops out at 1 kHz, you might start at 5.12 kS/s or higher; for speech/acoustics that needs to cover 20 kHz, common choices are 51.2 kS/s or 96 kS/s. In short: base it on the spectrum, keep some margin, and align it with your filtering and analysis.
    • Measurement accuracy and dynamic range: If your application needs to resolve weak signals while also covering large signal swings—for example, NVH tests often need to capture very low noise in quiet conditions and also record high SPL under strong excitation—you need a high-dynamic-range, high-resolution DAQ (24-bit ADC or higher, dynamic range > 120 dB). For audio testing, where distortion and noise floor matter and you want the DAQ's self-noise to be well below the DUT, choose a low-noise, high-SNR front end and check vendor specs such as THD+N.
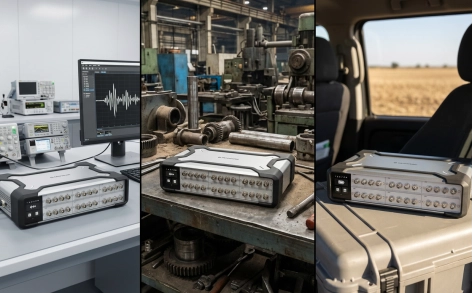
    • Environment and use constraints: Think about where the DAQ will be used: on a lab bench, on the factory floor, or outdoors in the field. If you need to travel frequently or test on a vehicle, a portable/rugged DAQ is usually a better fit.For scenarios without stable power for long periods, built-in battery capability and battery runtime become critical.
    • Lead time and after-sales support: After you define the procurement need, delivery lead time is a practical factor you can't ignore. If your schedule is tight, a 2–3 month lead time can directly delay project kickoff and execution, so evaluate the supplier's delivery commitment. Support is equally important: training, responsiveness when issues occur, and whether remote or on-site assistance is available. Also review warranty terms, software upgrade policy, and support response mechanisms—these directly affect long-term system stability and overall project efficiency.

    With the above steps, you can narrow down the DAQ characteristics that fit your application and make a defensible choice from a crowded product list. In short: start from requirements, focus on the key specs, plan for future expansion, and don't ignore vendor maturity and support. Choose the right tool, and testing becomes far more efficient.

    FAQ

    Q: Can I use a sound card as a DAQ?

    A: For a small number of audio channels where synchronization/range/calibration requirements are not strict, a sound card can “work” at a basic level. But in engineering test work, common issues are: no IEPE excitation, insufficient input range and noise floor, uncontrolled channel-to-channel sync, and driver latency that is high and unstable. If you need repeatable, traceable test data, use a professional DAQ front end.

    Q: What's the difference between a DAQ and an oscilloscope?

    A: An oscilloscope is more of an electronics debugging tool—great for capturing transients and doing quick troubleshooting. A DAQ is more of a long-duration, multi-channel, time-synchronized acquisition and analysis system, with an emphasis on channel scalability, synchronization consistency, long-term stability, and data management.

    Q: How do I choose the sampling rate?

    A: Start from the highest frequency/bandwidth of interest and meet Nyquist (>2× fmax) as a baseline. In practice, also account for the anti-aliasing filter transition band and your analysis method; starting at 2.5–5× bandwidth is usually safer. If you're unsure, prioritize proper filtering and dynamic range first, then optimize sampling rate.

    Q: What is IEPE, and when do I need it?

    A: IEPE is a constant-current excitation scheme used by sensors such as accelerometers and IEPE measurement microphones, with power and signal on the same cable. If you use IEPE sensors, your DAQ front end must support IEPE excitation, appropriate isolation/grounding strategy, and suitable input range and bandwidth.

    Q: What should I check for multi-channel / multi-device synchronization?

    A: Focus on three things: a common clock source (external clock/PTP/GPS, etc.), channel-to-channel sampling skew/delay, and trigger/alignment strategy. For NVH, array measurements, and structural modal testing, sync performance often matters more than single-channel specs.

    Q: How do I estimate channel count—and should I leave headroom?

    A: List the “must-measure” signals and points first, then add auxiliary channels such as tach/trigger/temperature. A good rule is to reserve at least 20%–30% headroom, or choose a modular platform that scales, so you're not forced to replace the system when points get added.

    If you'd like to learn more about the latest intelligent sound & vibration data acquisition system, SonoDAQ, from CRYSOUND, including its key features, typical application scenarios, and common configuration options, please fill out the Get in touch form below to contact the CRYSOUND team. 

    You're also welcome to reach out to the CRYSOUND team. Based on your constraints—such as signal types, channel count, sampling rate/bandwidth, synchronization requirements, and on-site environmental conditions—we can provide a product demo and practical configuration recommendations.

    SonoDAQ Enclosure Coating Hardness Test

    In real DAQ use, enclosure durability and scratch resistance directly affect service life and maintenance cost. This article shares a pencil hardness scratch test on the SonoDAQ top cover (PC + carbon fiber) and compares it with a typical laptop enclosure. The results show how the enclosure performs from 2H to 5H and why the surface finish helps it hold up in daily handling. How Scratch Resistance Affects DAQ Use When choosing a DAQ front end, engineers usually look first at the specs—sample rate, dynamic range, synchronization accuracy, channel count… But after a few years of real use, many realize that enclosure reliability and scratch resistance can be just as important to the system’s service life and day-to-day experience. For soundand vibration test equipment, this is even more obvious. Typical SonoDAQ applications include NVH road tests, on-site industrial measurements, and long-term outdoor or semi-outdoor acquisition, where the device often has to: be carried frequently, loaded into vehicles, or fixed on fixtures or test benches; be moved between lab desks, instrument carts, and tool cases; remain in close contact with other metal equipment, screwdrivers, laptops, and more. In such environments, a housing that scratches easily not only looks worn, but can also drive up maintenance and replacement costs. To better reflect daily handling, we ran a pencil-hardness scratch test on the SonoDAQ front-end upper cover and used a common laptop enclosure as a reference. Test Setup The test was performed strictly in accordance with ISO 15184:2020, and was intended to evaluate the scratch resistance of the UV-cured coating on the outer surface of the SonoDAQ front-end upper cover. Samples SampleDescriptionA — SonoDAQ top coverMaterial: PC + carbon-fiber plate (top/bottom covers), with an internal aluminum frame and corner protection.B — Typical laptop enclosureMaterial: Plastic/metal housing with a sprayed coating. This test follows the pencil hardness test approach. Pencils of different hardness grades were used to scratch the enclosure surface under consistent contact conditions, and the surface was inspected for any scratches visible to the naked eye. Test Tools Pencil hardness tester, additional weights can be added as required. Pencils: hardness grades 2H, 3H, 4H, and 5H. Procedure Insert the pencil into the pencil hardness tester at a 45° angle, with a total load of 750 g (equivalent to applying 7.5 N to the coating surface). For each pencil hardness grade, scratch the enclosure surface three times and check whether any visible scratches appear. Keep the scratch length and applied force as consistent as possible to ensure comparability across hardness grades. Results Criteria Whether visible scratches appear; Whether the surface gloss changes noticeably. Results From the results, we could see that the front-end enclosure showed different levels of scratch resistance under different pencil grades. To further validate durability, we ran the same pencil hardness test on a typical laptop enclosure. Laptop housings are usually plastic or metal and also have a painted surface. We used the same method as for the DAQ unit: 2H Pencil: SonoDAQ ProTypical Laptop Conclusion: Neither the SonoDAQ enclosure nor the laptop enclosure showed any obvious scratches; visually there was almost no change. 3H Pencil: SonoDAQ ProTypical Laptop Conclusion: Neither the SonoDAQ enclosure nor the laptop enclosure showed any obvious scratches; visually there was almost no change. 4H Pencil: SonoDAQ ProTypical Laptop Conclusion: At 4H, the SonoDAQ enclosure still showed no visible scratches; in contrast, the laptop enclosure exhibited clearly visible scuffs, essentially reaching the upper limit of its scratch resistance. 5H Pencil: SonoDAQ Pro Conclusion: At 5H, light scratches began to appear on the SonoDAQ enclosure, indicating it was approaching its scratch-resistance limit. Note that the pencil hardness test is primarily a relative comparison of scratch resistance between enclosures; it does not represent a material’s absolute hardness or long-term wear life. However, for assessing whether a surface is “easy to scratch” in everyday use, it is a very direct method. If we translate the pencil grades into typical real-world scenarios: Accidental rubbing from most keys, equipment edges, and tools usually falls in the 2H-3H range; 4H-5H corresponds to harder, sharper, and more forceful scratching—often with some deliberate pressure. At 4H, the SonoDAQ enclosure is still difficult to mark, and it only shows slight scratching at 5H. This means that during normal handling, loading, installation, and daily use, the enclosure is not easy to scratch. Why It Holds Up The SonoDAQ front-end enclosure uses a PC + carbon-fiber composite, which provides good mechanical strength and toughness. On top of that, the surface is finished with a spray-and-bake paint process plus a UV-cured top layer, which plays a key role in: Increasing surface hardness and improving scratch resistance; Improving corrosion resistance and environmental robustness; Balancing durability with a premium look and feel. For instrumentation, “harder” is not always “better.” The right design balances scratch resistance, impact resistance, weight, and long-term reliability. As the results show, SonoDAQ’s enclosure is durable enough for real-world use. For more information on SonoDAQ features, application scenarios, and typical configurations, please fill out the Get in touch form below to contact the CRYSOUND team. We will provide selection recommendations and support based on your test requirements.

    SonoDAQ Pro: Flexible Sound and Vibration DAQ System

    In sound and vibration testing, flexibility is a decisive factor—especially when test requirements evolve rapidly. SonoDAQ, with its modular, scalable architecture, helps users easily manage everything from simple tests with a single device to complex, large-scale, multi-channel data acquisition. Whether in laboratory environments or industrial sites, SonoDAQ provides efficient, accurate data acquisition solutions, maximizing the adaptability and scalability of the system. Easy Testing with One Device, Scalable Expansion with Multiple Devices When testing requirements are modest, such as road tests or basic vibration testing, SonoDAQ Pro can easily meet the required number of channels with a single device. In this case, users only need one device to perform high-precision data acquisition, which is efficient and helps avoid unnecessary upfront hardware investment. However, as testing needs increase, especially in scenarios that require numerous sensors or synchronized multi-channel acquisition, SonoDAQ offers flexible expansion solutions. Users can connect multiple SonoDAQ Pro units in a daisy-chain or star topology to achieve large-scale data acquisition. For example, when conducting NVH testing or sound and vibration testing for large equipment, users can add more devices as needed, scaling up to hundreds of channels while ensuring high-precision synchronization across all devices. This scalability allows customers to avoid purchasing entirely new acquisition systems each time. By simply cascading existing SonoDAQ Pro units, they can easily cover more complex testing needs and avoid the common issues of device redundancy and high costs seen in traditional systems. Flexible Configuration to Meet Various Needs Even without large-scale acquisition needs, SonoDAQ remains highly flexible. With its modular design, users can easily adjust and reconfigure the system according to changing test requirements. For instance, if only temperature or strain signals are required, users can simply select the corresponding module and insert it into the chassis, without purchasing a new mainframe. This design makes SonoDAQ suitable for everything from simple laboratory tests to complex field tests. Users can expand the system as needed, without worrying about future expansion limits. Whether it's basic data acquisition or advanced signal analysis, SonoDAQ provides accurate, flexible data acquisition solutions, significantly enhancing testing efficiency and cost-effectiveness. Flexibility Brought by Modular Design The modular design of SonoDAQ is the core of its flexibility. Users can select different input modules, output modules, sensor interface modules, and more based on project requirements, and easily plug-and-play or upgrade them as needed. Whether it's adding more sensor channels or expanding with new functional modules, users can quickly implement changes by swapping modules, without affecting the normal operation of the existing system. This design ensures long-term device usability and enables SonoDAQ to adapt to ever-changing test requirements. When future requirements change, such as testing additional signal types (e.g., temperature, pressure, strain), SonoDAQ Pro can easily meet these new testing needs by simply swapping modules, allowing the overall system to continue running efficiently without the need for a full system overhaul. For example, an automotive manufacturer needs to perform NVH testing. Initially, they may only need 4–8 channels for in-car noise testing. In this case, engineers can use a single SonoDAQ Pro device to complete routine testing tasks. When they need to expand the testing scope and add more sensors (such as measuring vibration, strain, or temperature at different locations), they can simply daisy-chain multiple SonoDAQ Pro devices together. Through synchronization technology, they can ensure data consistency across all devices without redesigning the system or changing existing test procedures. Beyond automotive NVH, the same scalable architecture can be applied to aerospace components, industrial machinery, and even high-channel-count consumer electronics testing. Expand as Needed, Effortlessly Tackle Any Testing Challenge The flexible expansion capability of SonoDAQ allows it to scale from simple single-channel testing to large-scale multi-channel data acquisition. Whether it's for in-vehicle testing, industrial monitoring, or scientific research, SonoDAQ provides accurate, reliable data acquisition solutions. Its modular design and flexible system topology not only meet current needs but also enable quick adaptation to evolving testing scenarios in the future. Choosing SonoDAQ means moving away from fixed hardware configurations and instead adjusting the system based on needs, ensuring smooth, repeatable execution of every test. SonoDAQ is ready to transform your testing process—from simple single-device setups to large-scale, multi-channel systems. Contact us now: fill out the “Get in touch” form below, and our team will get back to you shortly.

    SonoDAQ for Sound & Vibration Testing

    SonoDAQ is the next-generation high-performance data acquisition system, specifically designed for sound and vibration testing. It features a modular architecture, making data acquisition more efficient and precise. From industrial environments to laboratory measurements, SonoDAQ meets the demands of high-precision data acquisition and provides seamless support for multi-channel synchronized data collection. Modular Design, Flexible to Adapt to Various Applications SonoDAQ adopts a completely new modular design, allowing for flexible configuration based on different needs. Whether you require a basic 4-channel setup or a large-scale system with hundreds of channels, SonoDAQ can easily accommodate both. You can select modules according to your project requirements and expand the system at any time, avoiding unnecessary costs. This flexibility is particularly well-suited for dynamic and evolving testing environments. High-Precision Synchronization Ensures the Accuracy of Test Results In sound and vibration testing, data accuracy is crucial. SonoDAQ is equipped with a 32-bit ADC and a sampling rate of up to 204.8 kHz. It ensures time synchronization between channels with a time error of less than 100 ns through PTP (IEEE 1588) and GPS synchronization. This level of synchronization precision allows you to obtain reliable and consistent data results, even in multi-channel, large-scale distributed acquisition systems. Flexible System Expansion with Multiple Network Topologies Another highlight of SonoDAQ is its powerful distributed acquisition capability. With various network connection methods like daisy chain and star topology, multiple devices can be easily integrated into the same acquisition system. Leveraging PTP (Precision Time Protocol) and GPS synchronization technology, SonoDAQ ensures nanosecond-level synchronization, providing data consistency across devices, whether for small-scale laboratory tests or large-scale field data collection. You can choose different system topologies based on your specific needs, offering flexibility for complex testing scenarios. Innovative Structural Design, the Ideal Choice for Field Applications SonoDAQ's frame is made using 5000t aluminum extrusion technology combined with carbon fiber-reinforced plastic, offering exceptional sturdiness while significantly reducing the device's weight. Additionally, SonoDAQ supports PoE power supply and hot-swappable batteries, ensuring efficient operation even in harsh environments and meeting the demands of long-duration continuous acquisition. Whether in the laboratory or on industrial sites, SonoDAQ delivers stable performance. Extensive Signal Compatibility, Expanding Your Testing Boundaries SonoDAQ supports a variety of signal inputs, including IEPE sensors, CAN bus, digital I/O, and other interface protocols. This allows it to meet a wide range of testing needs, from vibration monitoring to motor noise analysis. Whether you're conducting basic data acquisition or advanced signal analysis, SonoDAQ provides the precision and flexibility you require. Enhance Testing Efficiency, Making Data Acquisition Simpler With the accompanying OpenTest software, SonoDAQ allows you to monitor and analyze collected signals in real-time. OpenTest offers an intuitive interface and powerful data analysis features, making it easier to process and present test data. Additionally, SonoDAQ supports open protocols like ASIO and OpenDAQ, facilitating integration with other testing tools or software. SonoDAQ will help streamline your testing process, improve data acquisition efficiency, and provide precise measurements in various complex testing environments. Whether it's noise testing, vibration analysis, or complex sound power measurements, SonoDAQ is your ideal choice. Choose SonoDAQ today and bring revolutionary changes to your testing work! SonoDAQ is ready to transform your testing process — don’t wait to experience its power. Contact us now! Please fill out the 'Get in touch' form below, and we'll get back to you shortly!

    Abnormal Noise Testing Explained: Principle,Method,and Configuration

    In our previous blog post, "Abnormal Noise Detection: From Human Ears to AI"we discussed the key pain points of manual listening, introduced CRYSOUND's AI-based abnormal-noise testing solution, outlined the training approach at a high level, and showed how the system can be deployed on a TWS production line. In this post, we take the next step: we'll dive deeper into the analysis principles behind CRYSOUND's AI abnormal-noise algorithm, share practical test setups and real-world performance, and wrap up with a complete configuration checklist you can use to plan or validate your own deployment. Challenges Of Detecting Anomalies With Conventional Algorithms In real factories, true defects are both rare and highly diverse, which makes it difficult to collect a comprehensive library of abnormal sound patterns for supervised training. Even well-tuned—sometimes highly customized—rule-based algorithms rarely cover every abnormal signature. New defect modes, subtle variations, and shifting production conditions can fall outside predefined thresholds or feature templates, leading to missed detections (escapes). In the figure below, we compare two wav files that we generated manually. Figure 1: OK Wav Figure 2: NG Wav You can see that conventional checks—frequency response, THD, and a typical rub & buzz (R&B) algorithm—can hardly detect the injected low-level noise defect; the overall curve difference is only ~0.1 dB. In a simple FFT comparison, the two wav files do show some discrepancy, but in real production conditions the defect energy may be even lower, making it very likely to fall below fixed thresholds and slip through. By contrast, in the time–frequency representation , the abnormal signature is clearly visible, because it appears as a structured pattern over time rather than a small change in a single averaged curve. Figure 3: Analysis results Principle Of AI Abnormal Noise Algorithm CRYSOUND proposes an abnormal-noise detection approach built on a deep-learning framework that identifies defects by reconstructing the spectrogram and measuring what cannot be well reconstructed. This breaks through key limitations of traditional rule-based methods and, at the principle level, enables broader and more systematic defect coverage—especially for subtle, diverse, and previously unseen abnormal signatures. The figure below illustrates the core workflow behind our training and inference pipeline. Figure 4: Algorithm Flow Principle During model training, we build the algorithm following the workflow below. Figure 5: Algorithm Judgment Principle How To Use And Deploy The AI Algorithm Preparation First, prepare a Low-Noise Measurement Microphone / Low-noise Ear Simulator and a Microphone Power Supply to ensure you can capture subtle abnormal signatures while providing stable power to the mic. Figure 6: Low-Noise Measurement Microphone Next, you'll need a sound card to record the signal and upload the data to the host PC. Figure 7: Data Acquisition System Third, use a fixture or positioning jig to hold the product so that placement is repeatable and every recording is taken under consistent conditions. Finally, ensure a quiet and stable acoustic environment: in a lab, an anechoic chamber is ideal; on a production line, a sound-insulation box is typically used to control ambient noise and keep measurements consistent. Figure 8: Anechoic Room Figure 9: Anechoic Chamber Model Development First, create a test sequence in SonoLab, select "Deep Learning" and apply the setting. Next, select the appropriate AI abnormal-noise algorithm module and its corresponding API Figure 10: Sequence Interface 1 Then open Settings and specify the model type, as well as the file paths for the training dataset and test dataset. Click Train and wait for the model to finish training (Training time depends on your PC's hardware) Figure 11: Sequence Interface 2 During training, the status indicator turns yellow. Once training is complete, it switches to green and shows a "Training completed" message. Figure 12: Sequence Interface 3 Finally, place your test WAV files in the specified test folder and run the sequence. The model will start automatically and output the analysis results. Test Case Figure 13:Test Environment Figure 14:Test Curve System Block Diagram Figure 15: System Block Diagram 1 Figure 16: System Block Diagram 2 Equipment More technical details are available upon request—please use the "Get in touch" form below. Our team can share recommended settings and an on-site workflow tailored to your production conditions.

    An Open Platform For Intelligent Sound Imaging

    In the fields of acoustic research and industrial inspection, sound is no longer just a signal to be "heard",but information that can be "seen". How to visualize, analyze, and quantify sound has been a long-standing pursuit for research institutions and engineers alike. Today, leveraging its deep expertise in acoustics, CRYSOUND has launched the new SonoCam Pi product series—not just an acoustic camera, but an open acoustic platform, redefining the future of acoustic measurement and imaging. Making Acoustic Experiments Simpler And More Efficient In recent years, microphone arrays have been rapidly adopted in acoustic research. However, research institutions commonly face the following challenges: Traditional systems are expensive and offer a limited number of channels. Array design and algorithm development are complex and time-consuming. In-house array development lacks mature supply chains and integrated hardware-software support. To address these challenges, CRYSOUND leveraging nearly 30 years of expertise in acoustic testing and signal processing, has developed the SonoCam Pi platform—an affordable, open, and programmable acoustic solution. It enables researchers, engineers, and university students to enter the world of acoustic imaging and algorithm validation more quickly, flexibly, and cost-effectively. An Acoustic Development Platform For Research And Industry Hardware Highlights: Large Arrays & Multi-Geometry Adaptability 208-channel MEMS microphone array, supporting replacement and customization. Array diameters of 30 cm / 70 cm / 110 cm, enabling easy switching between near-field and far-field measurements. Wideband response from 20 Hz to 20 kHz, suitable for both precision lab testing and on-site measurements. Modular design, allowing rapid deployment and flexible expansion. SonoCam Pi product appearance Software Ecosystem: Open APIs & Algorithm Freedom Provides an API for 208-channel raw audio waveform data. Comes with a MATLAB acoustic imaging algorithm Demo App for rapid algorithm validation. Built-in acoustic imaging algorithms including Far-field Beamforming and Near-field Acoustic Holography. Supports secondary development, enabling users to build customized acoustic analysis tools. In short, SonoCam Pi is not just a hardware device—it is a complete platform for acoustic algorithm development and experimental validation. From Lab To Factory: Applications Of SonoCam Pi Acoustic Drone Detection Powered by array-based localization and identification algorithms, SonoCam Pi can accurately capture the acoustic signature of drones, enabling reliable low-altitude acoustic detection to support security monitoring and drone detection for site security. Drone detection Acoustic Research & Algorithm Development Research institutions can leverage SonoCam Pi's 208-channel raw-data API and MATLAB demo tools to rapidly validate research algorithms such as Far-field Beamforming and Near-field Acoustic Holography. Algorithm development Sound Propagation Path Analysis Supports directional analysis of both structure-borne and airborne sound propagation, helping researchers and engineers more intuitively understand the transmission mechanisms of noise sources. Sound propagation path analysis Automotive NVH Noise Inspection By combining beamforming and acoustic holography techniques, SonoCam Pi can quickly pinpoint interior and exterior noise sources, visualize acoustic radiation, and support NVH optimization as well as overall vehicle sound quality improvement. NVH research Open · Efficient · Intelligent: A New Start For Acoustic Research Whether for algorithm validation in university laboratories or noise diagnostics in industrial environments, SonoCam Pi has become a new-generation acoustic tool for both research and engineering practice, thanks to its outstanding performance, comprehensive ecosystem, and high level of openness. It makes acoustic measurement more portable, more intelligent, and more open—not only enabling users to see sound, but also empowering researchers to reshape the way sound is understood. SonoCam Pi is more than an acoustic camera; it is an acoustic application ecosystem platform. As technology and acoustic algorithms continue to evolve, CRYSOUND will keep advancing SonoCam Pi, enabling acoustic imaging to unlock new potential across more fields and working hand in hand with research and industrial users to explore the limitless possibilities of the acoustic world. If you'd like to learn more about the applications of CRYSOUND's SonoCam Pi, or discuss the most suitable solution for your needs, please contact us via the form below. Our sales or technical support engineers will get in touch with you shortly.

    Automotive HVAC Air Vent EoL Test Case

    This integrated single-station EoL test solution enables automotive HVAC air vent suppliers to perform NVH (noise/BSR), motor electrical testing, and vane presence detection in a single inspection step, helping to improve overall test efficiency and reduce labor dependency. System Block Diagram of the Automotive HVAC Air Vent Test Solution Modern automotive HVAC air vent assemblies increasingly integrate multiple drive motors, multi-row vanes (louvers), and smart features such as automatic airflow control and voice interaction. As a result, upstream process variation or assembly defects can translate directly into vehicle-level concerns—typically perceived as abnormal noise, buzz/squeak/rattle (BSR), airflow direction mismatch, or reduced airflow caused by missing/misassembled vanes. To reduce rework and prevent customer complaints, suppliers increasingly require 100% end-of-line (EoL) testing on the production line, covering NVH (noise/BSR), motor electrical testing, and vane presence detection. CRYSOUND Single-Station EoL Test Solution CRYSOUND’s automotive HVAC air vent EoL test solution enables customers to perform single-station, 100% testing of noise/BSR, motor electrical testing, and vane presence detection. The solution integrates CRYSOUND’s in-house hardware and software, CRY3203-S01 measurement microphone set, SonoDAQ, CRY7869 acoustic test box, and OpenTest. And it combines electroacoustic measurement with abnormal noise analysis (sound quality and AI-based algorithms) to identify noise/BSR issues that FFT and Leq may miss. It also integrates motor electrical testing and vane presence detection, enabling one-time clamping and a single OK/NG decision within the same sound-insulated EoL station. Schematic of the HVAC Air Vent Test Fixture Customer Results: Efficiency, Labor, and Quality Gains Replaced manual listening with machine-based detection, enabling unified criteria with quantitative, traceable results. One fixture, three test positions: supports parallel or mixed testing of left/center/right dashboard air vents, improving efficiency by >100%. Variant support via fixture changeover: reuse the same test station across different products, reducing repeated capital investment. One-operator, one-click inspection: a single line can save 1–2 long-term operators. EoL Test Equipment for Automotive HVAC Air Vent Typical Target Users This solution is designed for suppliers of motorized air vents and other motor-driven interior components,such as Valeo S.A.,Ningbo Joysonquin Automotive Systems Co., Ltd. and Jiangsu Xinquan Automotive Trim Co., Ltd. Main Hardware and Software Configuration ProductQty.NoteCRY3203-S01 Measurement Microphone Set1Measurement Microhone SetCRY5820 SonoDAQ Pro1Audio AnalyzerCRY7869 Acoustic Test Box1Test EnvironmentOpenTesthttp://www.opentest.com1SoftwareFixture1CustomizablePC & Monitor1(Optional) Feel free to fill in the form below ↓to contact us. Our team can share application-specific EoL testing recommendations based on your automotive HVAC air vent requirements.

    Get in touch

    If you are interested or have questions about our products, book a demo and we will be glad to show how it works, which solutions it can take part of and discuss how it might fit your needs and organization.

    Support Support
    Product Catalogs Product Catalogs Solutions Solutions User Manuals User Manuals Software Download Software Download Product Inquiry Product Inquiry Schedule Demo Schedule Demo Technical Support Technical Support +86-571-88225128 +86-571-88225128
    Request Quote 0
    Request Quote