Under regulations such as the EU Machinery Noise Directive, more and more products—from toys and power tools to IT equipment—are required to declare their sound power level on labels and in documentation, rather than simply claiming they are “quiet enough.”
For typical office devices like notebook computers, idle noise is often around 30 dB(A), while full-load operation can approach 40 dB(A). These figures are usually obtained from sound power measurements performed in accordance with ISO 3744 and related standards.
Sound Pressure vs. Sound Power
A noise source emits sound power, while what we measure with a microphone is sound pressure.
Sound pressure varies with room size, reverberation, and microphone distance, whereas sound power is the source’s own “noise energy” and does not change with installation or environment. That makes sound power a better metric for external product noise specification.
In simple terms:
- Sound power is the cause – the energy emitted by the source (unit: W / dB);
- Sound pressure is the effect – the sound pressure level we hear and measure (unit: Pa / dB).
ISO 3744 defines how to do this in an “essentially free field over a reflecting plane”: arrange microphones around the source on an enveloping measurement surface, measure the sound pressure levels on that surface, then apply specified corrections and calculations to obtain stable, comparable sound power levels.
Device Under Test: An Everyday Notebook Computer
Assume our DUT is a 17-inch office notebook. The goal is to determine its A-weighted sound power level under different operating conditions (idle, office load, full load), in order to:
- Compare different cooling designs and fan control strategies;
- Provide standardized data for product documentation or compliance;
- Supply baseline data for sound quality engineering (for example, whether the fan noise is annoying).
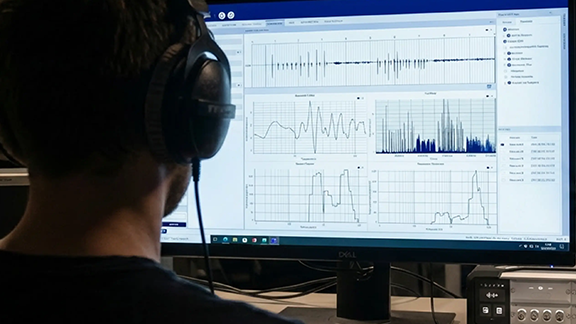
The test environment is a semi-anechoic room with a reflecting floor. The notebook is placed on the reflective plane, and multiple microphone positions are arranged around it (using a hemispherical frame or a regular grid). Overall, the setup satisfies ISO 3744 requirements for the measurement surface and environment.
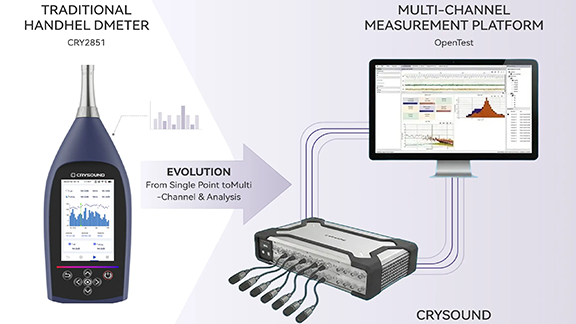
Measurement System: SonoDAQ Pro + OpenTest Sound Power Module
On the hardware side, we use SonoDAQ Pro together with measurement microphones, arranged around the notebook according to the standard.
OpenTest connects to SonoDAQ via the openDAQ protocol. In the channel setup interface, you select the channels to be used and configure parameters such as sensitivity and sampling rate.
From Standard to Platform: Why Use OpenTest for Sound Power?
OpenTest is CRYSOUND’s next-generation platform for acoustic and vibration testing. It supports three modes—Measure, Analysis, and Sequence—covering both R&D laboratories and repetitive production testing.
For sound power applications, OpenTest implements a sound-pressure-based solution fully compliant with ISO 3744 (engineering method), and also covering ISO 3745 (precision method) and ISO 3746 (survey method). You can flexibly select the test grade according to the test environment and accuracy requirements. The platform includes dedicated sound power report templates that generate standards-compliant reports directly, avoiding repeated manual work in Excel.
On the hardware side, OpenTest connects to multi-brand DAQ devices via openDAQ, ASIO, WASAPI, and NI-DAQmx, enabling unified management of CRYSOUND SonoDAQ, RME, NI and other systems. From a few channels for verification to large microphone arrays, everything can be handled within a single software platform.
Three Steps: Running a Standardized ISO 3744 Sound Power Workflow
Step 1: Parameter Setup and Environment Preparation
After creating a new project in OpenTest:
- In the channel setup view, select the microphone channels to be used and configure sensitivity, sampling rate, frequency weighting, and other parameters.
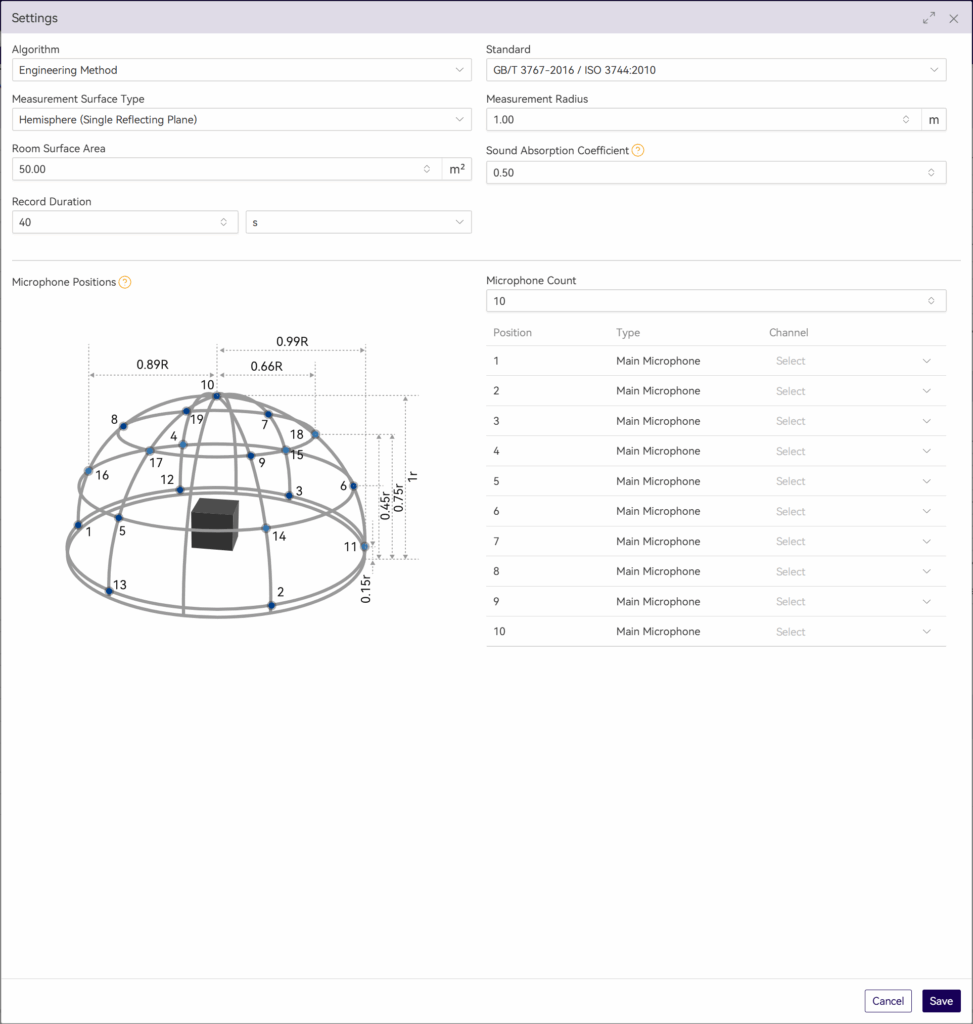
- Switch to Measure > Sound Power and set the measurement parameters:
- Test method and measurement-surface-related parameters;
- Microphone position layout;
- Measurement time;
- Other parameters corresponding to ISO 3744.
This step effectively turns the standard’s clauses into a reusable OpenTest scenario template.
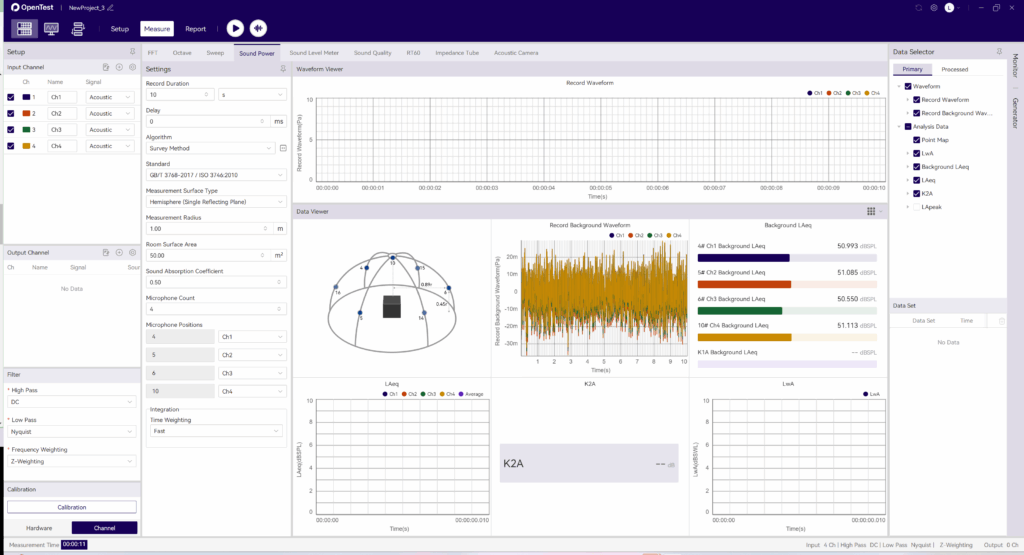
Step 2: Measure Background Noise First, Then Operating Noise
According to ISO 3744, you must measure sound pressure levels on the same measurement surface with the device switched off and device running, in order to perform background noise corrections.
In OpenTest, this is implemented as two clear operations:
- Acquire background noise
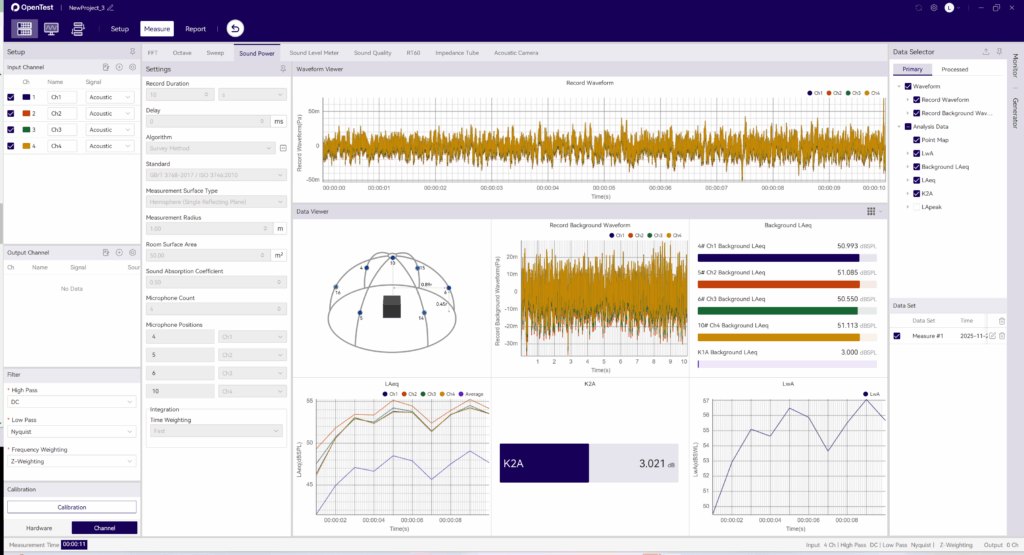
Click the background-noise acquisition icon in the toolbar. OpenTest records ambient noise for the preset duration.- In the survey method, OpenTest updates LAeq for each channel once per second;In the engineering and precision methods, it updates the LAeq of each 1/3-octave band once per second.
- Acquire operating noise
After background acquisition, click the Test icon. OpenTest will:
a. Record notebook operating noise for the preset duration;
b. Update real-time sound pressure levels once per second;
c. Automatically store the run as a data set for later replay and comparison.
Step 3: From Multiple Measurements to One Standardized Report
After completing multiple operating conditions (for example: idle, typical office work, full-load stress):
- In the data set view, select the records you want to compare and overlay them to observe sound power differences under different conditions;
- In the Data Selector, click the save icon to export the corresponding waveform files and CSV data tables for further processing or archiving;
- Click Report in the toolbar, fill in project and device information, select the data sets to include, adjust charts and tables, and export an Excel report with one click.
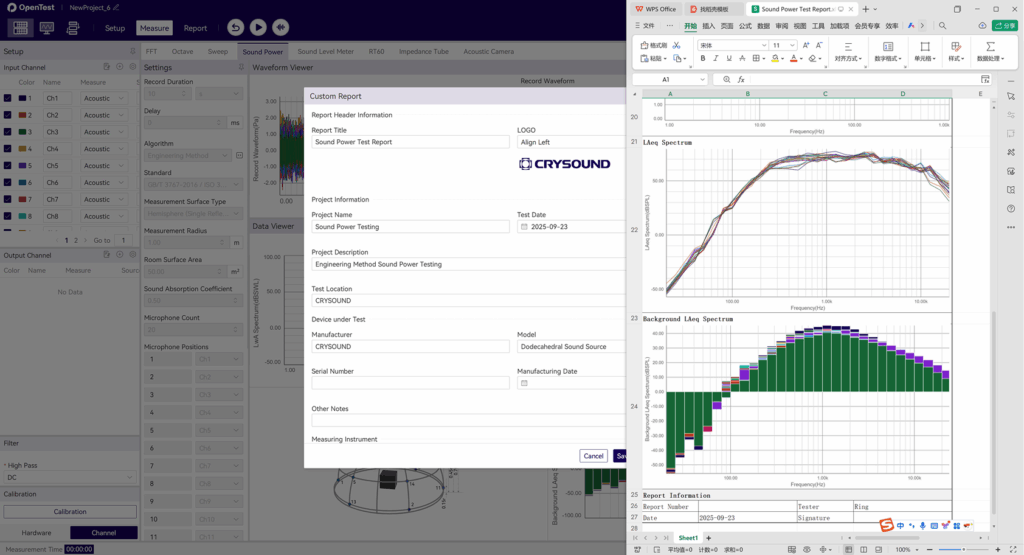
The report includes measurement conditions, measurement surface, band or A-weighted sound power levels, background corrections, and other key information. It can be used directly for internal review or regulatory/customer submissions, following the same idea as other standardized sound power reporting solutions.
From a Single Notebook Test to a Reusable Sound Power Platform
Running an ISO 3744 sound power test on a notebook is just one example. More importantly:
- The standardized OpenTest scenario can be cloned for printers, home appliances, power tools, and many other products;
- Multi-channel microphone arrays and SonoDAQ hardware can be reused across projects within the same platform;
- The test workflow and report format are “locked in” by the software, making it easier to hand over, review, and audit across teams.
If you are building or upgrading sound power testing capability, consider using ISO 3744 as the backbone and OpenTest as the platform that links environment, acquisition, analysis, and reporting into a repeatable chain—so each test is clearly traceable and more easily transformed from a one-off experiment into a lasting engineering asset.
Visit www.opentest.com to learn more about OpenTest features and hardware solutions, or contact the CRYSOUND team by filling out the “Get in touch” form below.
OpenTest
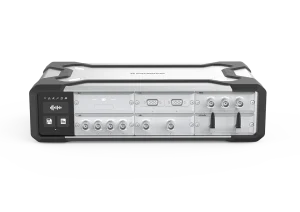
SonoDAQ Pro