CRYSOUND POCKET Acoustic Imaging Camera Now Available on Kickstarter.
CRYSOUND POCKET Acoustic Imaging Camera Now Available on Kickstarter.


Blogs
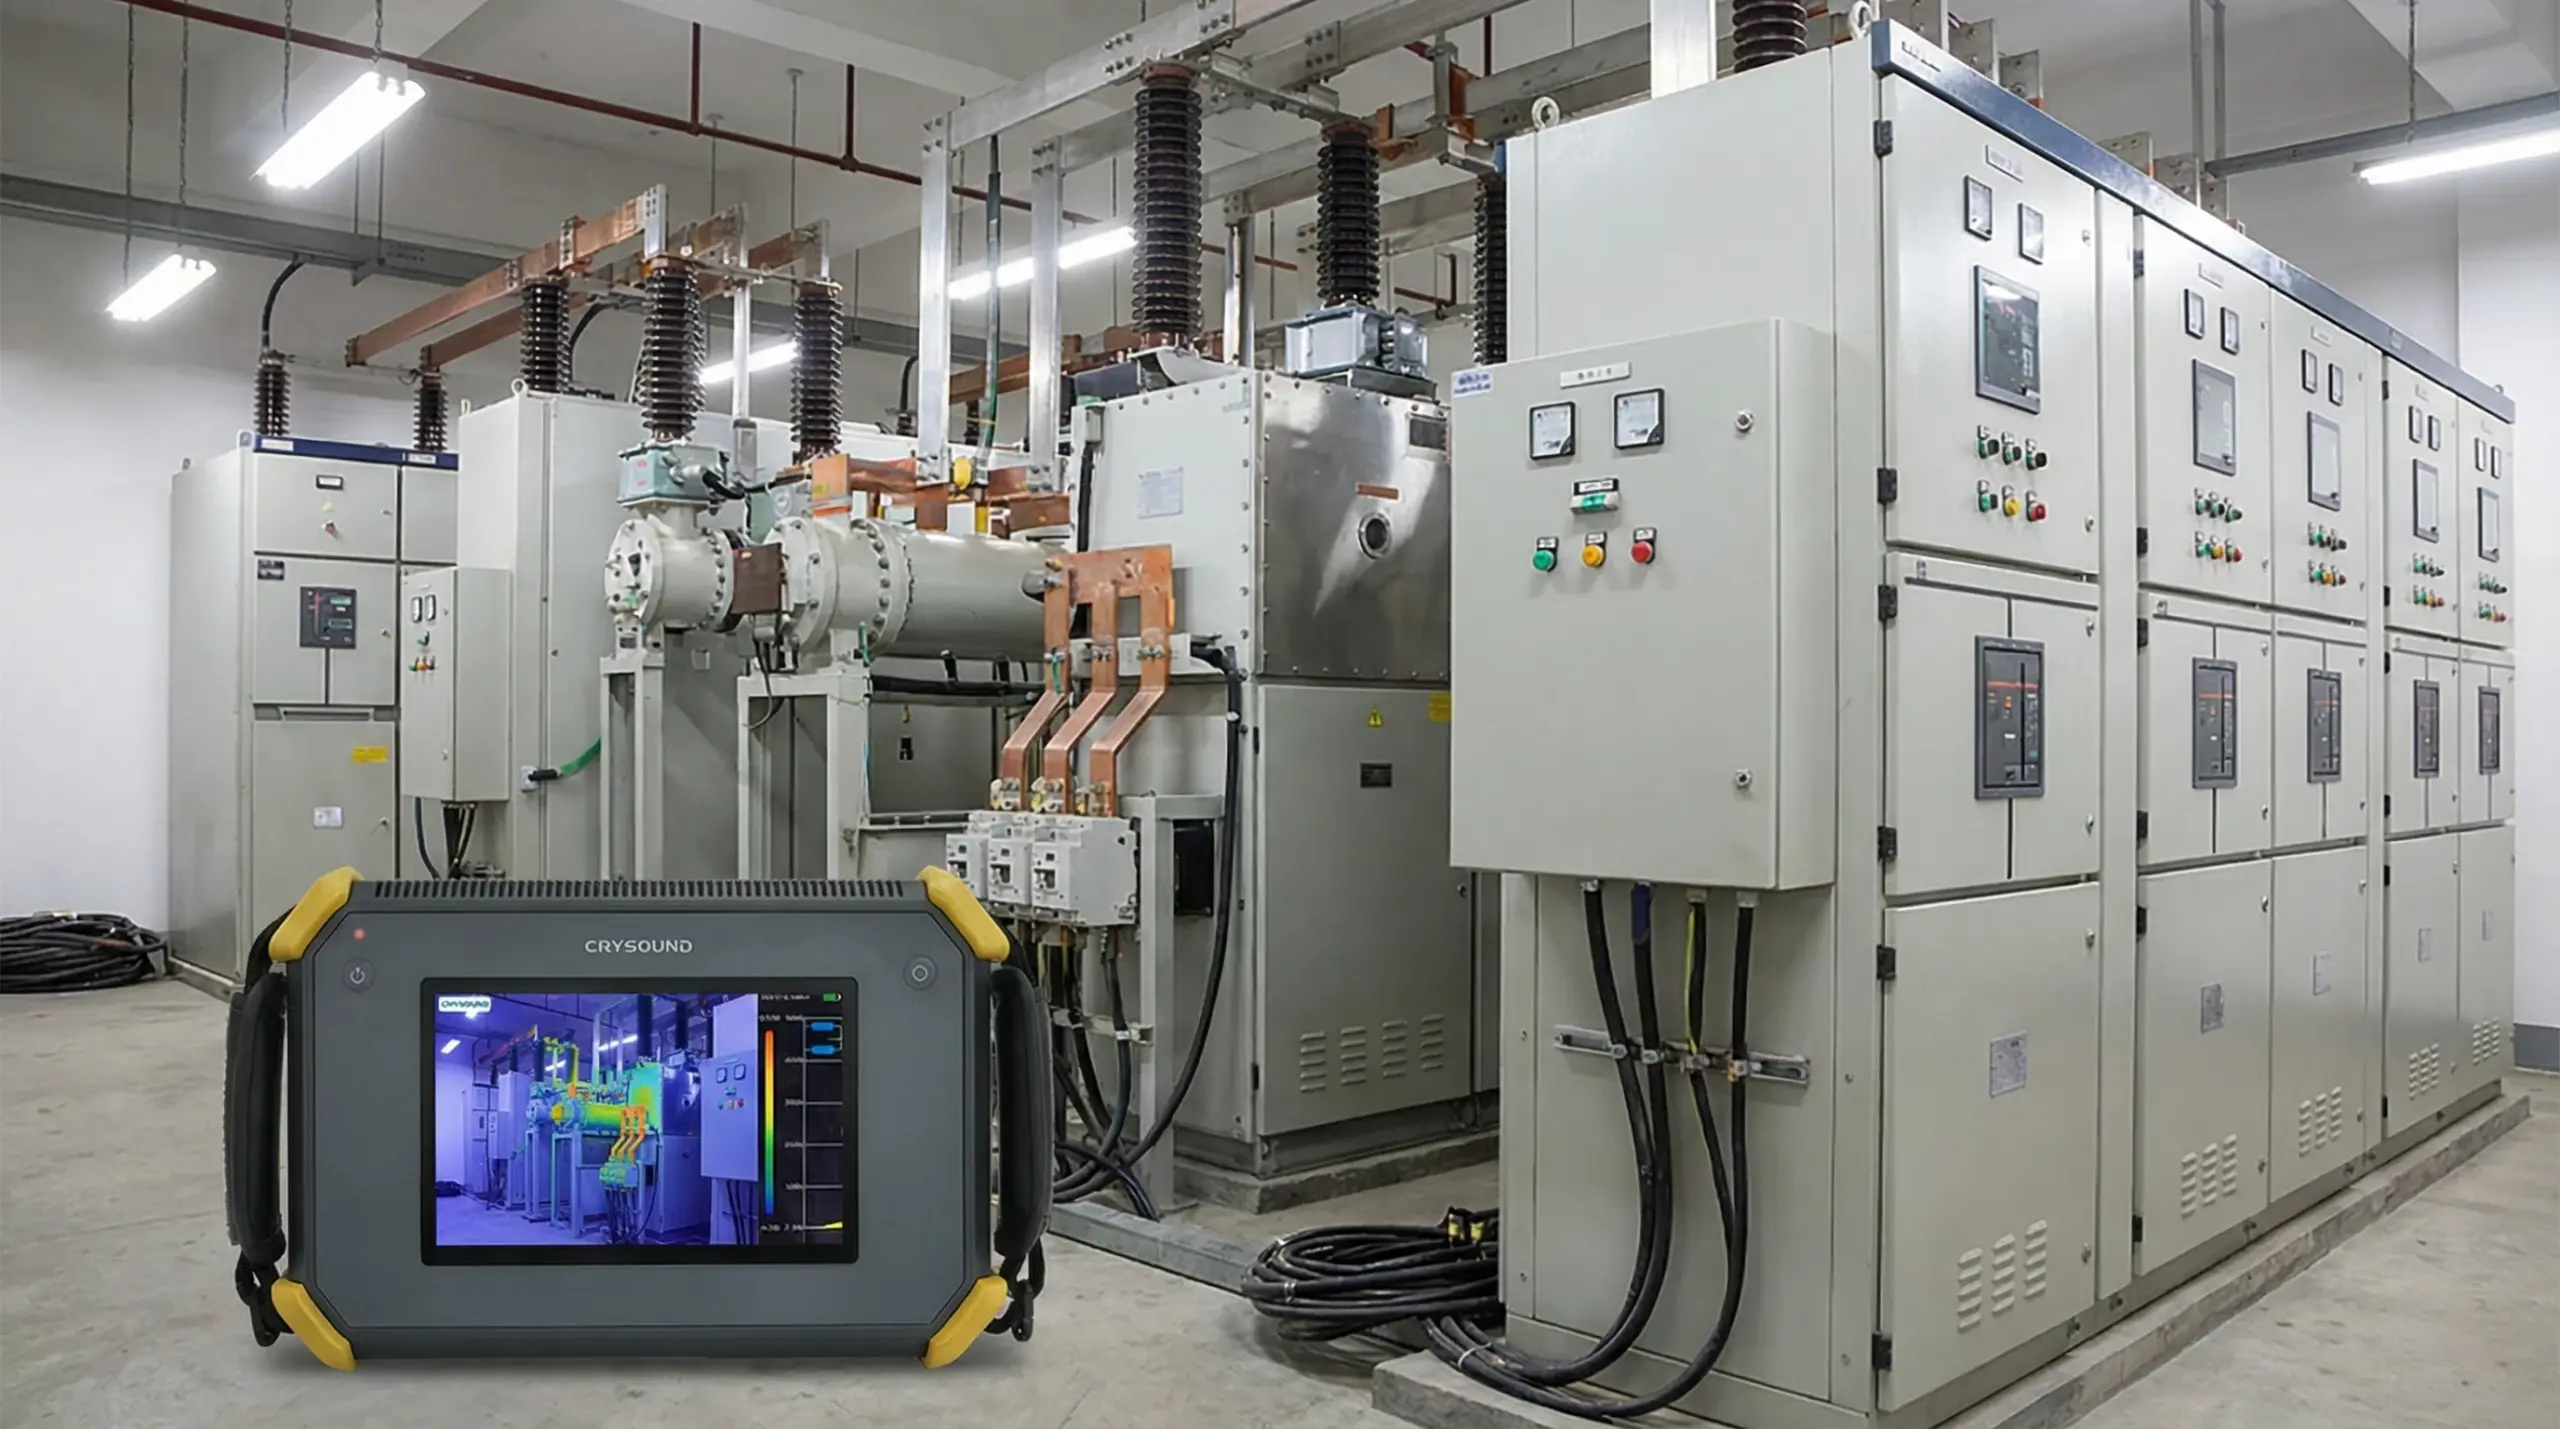
Partial discharge (PD) signals were detected in the medium-voltage switchgear of a plant, raising concerns about the safety and stability of the electrical system. To ensure safe inspection, the technical team isolated the affected area by cutting power. Corrective measures included applying high voltage from an external source to the equipment and using advanced detection tools to accurately identify the location and root cause of the discharge. During the investigation, two main methods were employed to detect and analyze PD signals: Ultrasound Transient Earth Voltage (TEV) Detection and Diagnosis Floating Partial Discharge (PD) signals were detected at the medium-voltage switchgear panels of a plant using EA UltraTEV Plus² with Ultrasound and Transient Earth Voltage (TEV) methods. However, the exact location of the PD could not be determined. Figure 1. TEV measurement showing a 30 dB floating pattern in MV switchgear, indicating likely internal partial discharge. Figure 2. Ultrasound measurement showing a 26 dBμV PD pattern in MV switchgear with clustered discharge activity. Pinpointing the Source with CRY2623 To further investigate, high voltage from an external source was applied to the circuit breaker within the open switchgear panel. The CRYSOUND CRY2623 device — capable of recording partial discharge signals in the form of images, sound, and diagrams — was then used to visually and accurately identify the precise source of the discharge signals. As a result, the plant's power outage time was significantly reduced. Figure 3. CRY2623 acoustic imaging locating floating PD at the upper pole field deflector of the circuit breaker. Root Cause Identified The source of PD signal was identified at the field deflectors of the upper pole of the circuit breaker. Upon inspection, it was discovered that the field deflector was loose and showed signs of no contact with the busbar, due to the rubber O-ring beneath the deflector being thinner than the design specification. Figure 4. Inspection showing the thin O-ring beneath the field deflector, identified as the root cause of floating PD. Verification After Repair A thicker rubber O-ring was installed as a replacement. After re-energizing the equipment, the partial discharge (PD) signal was rechecked to verify improvement. Figure 5. Repair showing replacement with a thicker O-ring beneath the field deflector to correct floating PD. Figure 6. Post-repair ultrasound and TEV results showing noise-level ultrasound and 5 dB TEV with no concern. The CRYSOUND CRY2623 acoustic imaging camera enables engineers to accurately localize partial discharge sources in real time - reducing diagnostic time, minimizing unplanned downtime, and keeping your electrical systems running safely. Whether you're dealing with switchgear, transformers, or cables, the CRY2623 delivers fast, reliable fault detection so you can act before small issues become costly failures. Interested in learning more? Fill in the Get in touch form below and our team will get back to you shortly. About the Author PSTS (Vietnam) – PSTS is a trusted partner providing industrial maintenance equipment (online and offline) and advanced CBM solutions to enhance customer asset safety and reliability throughout their life cycle. Website: https://psts.co
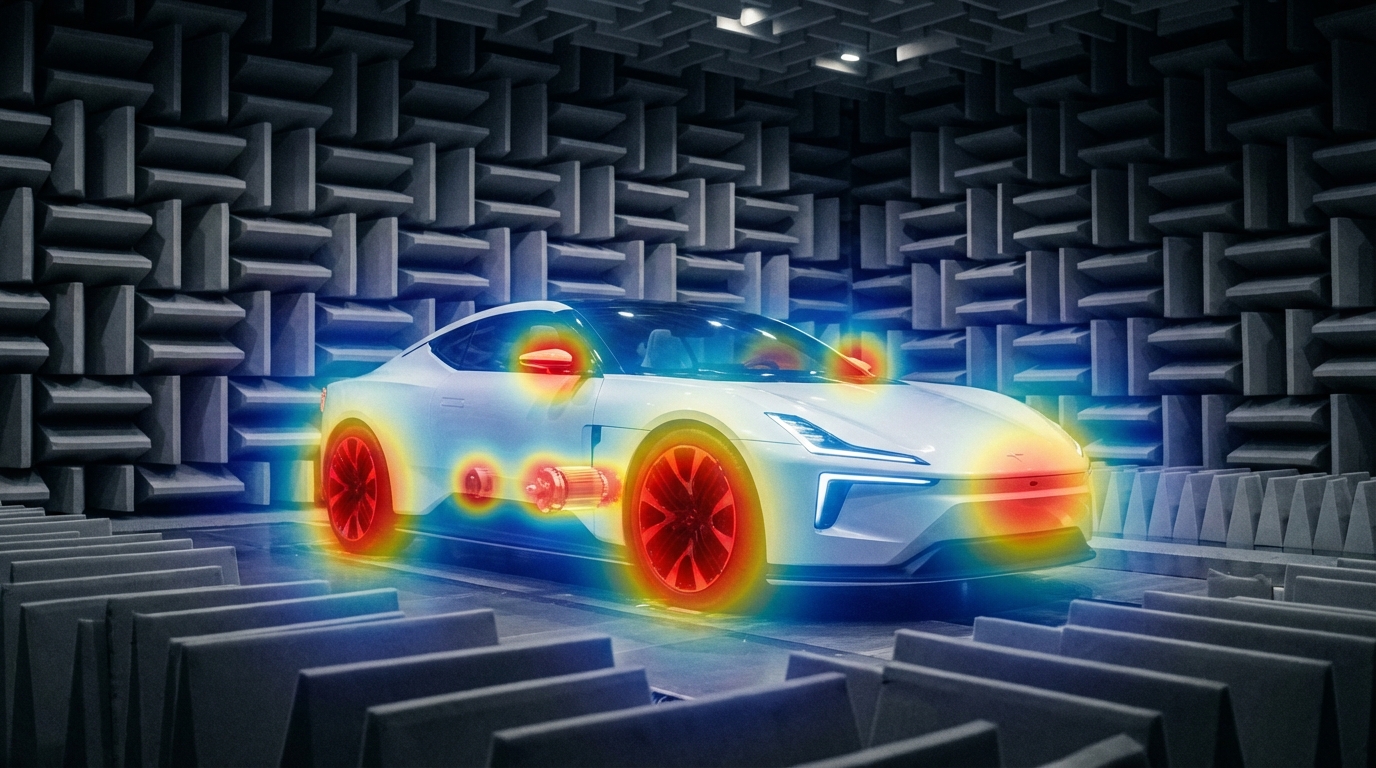
Traditional NVH tools still matter, but they don't cover every EV scenario—acoustic cameras fill the gap with real-time noise visualization and wide-band diagnostics. The Quiet EV Paradox: Why Electric Cars Are Actually "Noisier" It sounds like a paradox — electric vehicles have no roaring engine, yet engineers are finding it harder than ever to achieve a truly quiet cabin. The truth is, when the low-frequency masking effect of the internal combustion engine disappears, every previously hidden noise becomes fully exposed: the high-frequency whine of the electric motor, the electromagnetic hum of the inverter, gear meshing vibrations, wind noise, road noise, even the squeak and rattle of interior trim — nothing can hide anymore. This isn't just a comfort issue. It's fundamentally redefining the automotive industry's approach to NVH (Noise, Vibration, and Harshness) testing. The global automotive NVH testing market is projected to grow from USD 3.51 billion in 2026 to USD 5.75 billion by 2034, at a CAGR of 6.4%. The core driver behind this growth? The electrification revolution. What New Noise Challenges Do EVs Bring? A Fundamental Shift in Frequency Range Traditional ICE vehicle NVH work focuses on the 20–2,000 Hz low-frequency range — engine firing, exhaust systems, crankshaft vibrations. Electric vehicles are fundamentally different: Noise SourceTypical Frequency RangeCharacteristicsElectric motor electromagnetic noise500–5,000 HzSharp tonal noise, varies linearly with speedInverter switching noise4,000–10,000+ HzHigh-frequency hum, related to PWM frequencyGear meshing noise800–3,000 HzParticularly prominent in single-speed reducersBattery charger noise8,000–20,000 HzNear-ultrasonic range, at the edge of human perceptionWind / Road noise200–4,000 HzHighly exposed without engine masking ICE vs EV: The fundamental shift in noise frequency characteristics Key insight: EV noise problems shift from low frequencies to mid-high frequencies (and even ultrasonic ranges). The 100Hz-5kHz range is where most critical NVH issues reside—precisely where human hearing is most sensitive. Traditional NVH testing methods and frequency ranges may no longer be sufficient. New Noise Sources, New Localization Challenges In the ICE era, the assumption that "the engine is the dominant noise source" made things relatively straightforward. In EVs, noise sources become more distributed and complex: Electric drive system: The motor + inverter + reducer form a highly coupled noise system Thermal management: Battery cooling pumps and fans become dominant noise sources at low speeds Regenerative braking: Changes in inverter operating modes during energy recovery produce transient noise Structural transmission paths: Lightweight body structures (aluminum alloy, carbon fiber) have fundamentally different sound insulation characteristics compared to traditional steel This means engineers face a core challenge: How do you quickly and accurately locate the root cause among multiple distributed, dynamically changing noise sources? Sound Quality Design: From "Reducing Noise" to "Crafting Sound" NVH engineering in the EV era is no longer just about "minimizing noise." Consumers expect a carefully designed sound experience: Acceleration should feel "high-tech" without being harsh The cabin should be quiet, but not so silent that it makes the driver uneasy Different driving modes (Sport / Comfort / Eco) should deliver differentiated acoustic feedback This demand for "Sound Design" is expanding NVH testing from pure engineering validation into subjective sound quality evaluation and brand-level acoustic identity. Why Acoustic Cameras Are Becoming Essential for EV NVH Facing these new challenges, traditional NVH testing tools — single-point microphones, accelerometers — remain important but are no longer sufficient for every scenario. Acoustic cameras are filling this gap. Core Advantages of Acoustic Cameras 1. Real-Time Noise Source Visualization Traditional methods require densely placing microphone arrays on the target object — time-consuming and labor-intensive. Acoustic cameras use beamforming technology to generate a noise source heatmap in a single capture, instantly showing "where the noise is and how loud it is." Typical scenario: An EV prototype running on a test bench, the acoustic camera aimed at the electric drive system, instantly revealing that an 800 Hz resonance originates primarily from the right side of the motor — the entire localization process takes less than 5 minutes. Engineer conducting noise source localization test Automotive NVH detection and optimization 2. Wide Frequency Coverage EV noise spans from hundreds of hertz (gear meshing) to tens of thousands of hertz (inverter switching noise) — an enormous frequency range. Critical consideration for NVH: Most EV noise issues occur in the 100Hz-5kHz range—gear meshing, motor electromagnetic noise, wind leaks, HVAC systems. Traditional acoustic imaging cameras (limited to frequencies above 5 kHz) cannot capture these noise sources. Take the CRYSOUND SonoCam Pi (CRY8500 Series) as the ideal example: its 208 MEMS microphone array provides: Beamforming frequency range: 400 Hz - 20 kHz (covers the entire NVH audible spectrum) Near-field acoustic holography range: 40 Hz - 20 kHz (captures low-frequency road noise and structural vibration) Array size: >30 cm (optimized for low-frequency spatial resolution) This makes SonoCam Pi uniquely suited for full-spectrum EV NVH testing—from low-frequency road noise to high-frequency motor whine, all in a single handheld device. 3. Non-Contact Measurement EV electric drive systems are highly integrated and spatially compact. The non-contact measurement approach of acoustic cameras means: No disassembly of any components required No interference with the operating state of the system under test Rapid quality inspection directly on the production line 4. Portability Modern handheld acoustic cameras like the SonoCam Pi can be taken directly to proving grounds, production lines, or customer sites, no complex setup required. Typical Application Scenarios in EV NVH ScenarioApplicationE-drive system NVHLocating order-based noise contributions from motors, inverters, and reducersPass-by noise testingAnalyzing noise source distribution as vehicles pass byInterior squeak & rattle trackingLocating noise from dashboards, doors, seats, and trimEnd-of-line production QCRapid online detection of abnormal noise, replacing subjective human judgmentWind tunnel / Semi-anechoic chamberHigh-precision noise source localization and sound power analysis Real-World Case Study: OEM Dynamic Road Testing Client: A leading Chinese OEMLocation: An OEM test center, internal test trackObjective: Identify in-cabin noise sources during dynamic driving conditions CRY8500 Series SonoCam Pi acoustic cameras Test Setup Device:SonoCam Pi acoustic camera Measurement positions:Rear seat and front passenger seat Target areas:Left and right B-pillars (rear cabin area) Test mode:Beamforming app Frequency range:3,550 Hz - 7,550 Hz Dynamic range:5 dB Key Results SonoCam Pi successfully localized noise sources in real-time during vehicle motion, providing actionable data for OEM's NVH engineering team. The test demonstrated: Real-time localization during dynamic conditions: Unlike fixed laboratory setups, SonoCam Pi captured noise distribution while the vehicle was in motion on the test track Precise frequency-band analysis: By focusing on the 3,550-7,550 Hz range (critical for perceived cabin noise), engineers pinpointed specific contributors rather than measuring overall SPL Rapid testing workflow: Complete B-pillar area scan in minutes, not hours Noise Source Localization Results Key Insight: Traditional microphone arrays would require the vehicle to be stationary in a semi-anechoic chamber. SonoCam Pi enabled on-track diagnostics, dramatically reducing testing time and enabling rapid iteration during vehicle development. Future Trends — What's Next for EV NVH Testing? AI-Driven Noise Classification Machine learning is being integrated into NVH testing workflows: automatically identifying noise types, determining whether anomalies exist, and predicting potential quality issues. The high-dimensional data captured by acoustic cameras is naturally suited for AI analysis. Digital Twins and Simulation-Test Integration Simulation (CAE) predicts noise performance → Acoustic camera validates through physical measurement → Data feeds back to optimize the simulation model. This closed-loop approach is becoming the standard workflow for major OEMs. New Challenges in the Solid-State Battery Era Solid-state batteries have different mechanical properties compared to liquid lithium-ion batteries. Their vibration transmission characteristics and thermal management approaches will introduce new NVH challenges. Stricter Regulations Pass-by noise testing is the fastest-growing NVH sub-segment (CAGR 7.11%), with UNECE pushing for stricter standardized testing requirements, including indoor pass-by testing protocols. Conclusion: The Value of Acoustic Testing, Redefined for the EV Era Electrification hasn't made cars quieter — it has made noise challenges more complex, more nuanced, and more valuable to solve. For automotive OEMs, Tier 1 suppliers, and testing service providers, investing in the right NVH testing equipment is no longer a "nice-to-have" — it's foundational infrastructure for competitiveness. Acoustic cameras—especially those capable of capturing the critical 100Hz-5kHz NVH frequency range—are evolving from "useful auxiliary tools" to "indispensable standard equipment." The CRYSOUND SonoCam Pi stands out as the only handheld acoustic camera that combines: Low-frequency capability (400 Hz beamforming, 40 Hz holography) High spatial resolution (208 microphones, >30 cm array) Near-field + far-field measurements in a single system Portability (handheld, <3 kg, production-ready) Learn more: CRYSOUND SonoCam Pi (CRY8500 Series) → Contact us for NVH testing solutions →

During pilot production and production line ramp-up, many issues do not appear in the way teams initially expect. Sometimes it starts with a small fluctuation at a test station, or a comment from a line engineer saying, "This result looks a bit unusual."However, when takt time, yield targets, and delivery milestones are all under pressure, these seemingly minor anomalies can quickly be amplified and begin to affect the overall production rhythm. We have been working with Huaqin as a long-term partner. As projects progressed, the challenges encountered on the production line became increasingly complex. On site, our role gradually extended from basic production test support to problem analysis and cross-team coordination during pilot production. In many cases, the focus was not simply on whether a test station was functioning, but on how to absorb uncertainties early and prevent them from disrupting delivery schedules. The following two experiences both took place during the pilot production phase of Huaqin projects. They are not exceptional cases. On the contrary, they represent the kind of everyday issues that most accurately reflect the realities of production line delivery. Airtightness Testing Issues in Project α During the pilot ramp-up of Project α, the airtightness test station for the audio microphone showed clear instability. For the same batch of products, pass rates fluctuated noticeably across repeated tests, frequently interrupting the station's operating rhythm. Initial troubleshooting naturally focused on the test system itself, including software logic, equipment status, and basic parameter settings. It soon became clear, however, that the issue did not originate from these areas. As on-site verification continued, we gradually confirmed that the anomaly was more closely related to the product's mechanical structure and material characteristics. This model used a relatively uncommon combination of materials. A sealing solution that had worked well in previous projects could not maintain consistency during actual compression. Even slight variations in applied pressure were enough to influence test results. Once the direction of the problem was clarified, the on-site approach shifted accordingly. Rather than repeatedly adjusting the existing solution, we returned to verifying the compatibility between materials and structure. Over the following period, we worked together with the customer's engineering team on the production line, testing multiple material options. This included different types of silicone and cushioning materials, variations in silicone hardness, and adjustments to plug compression methods. Each step was evaluated based on real test results before moving forward. The process was not fast, nor was it particularly clever. In essence, it came down to repeatedly confirming one question: could this solution run stably under real production line conditions?Ultimately, by introducing a customized soft silicone gasket and making fine parameter adjustments, the airtightness test results gradually stabilized. The station was able to run continuously, and the pilot production rhythm was restored. Figure 1. Test Fixture Diagram Noise Floor Issues in Project β Compared with the airtightness issue in Project α, the noise floor anomaly encountered during pilot production in Project β was more complex to diagnose. During headphone pilot production for Project β at Huaqin's Nanchang site, the noise floor test station repeatedly triggered alarms. Test data showed that measured noise levels consistently exceeded specification limits, significantly impacting the pilot production schedule. This model used high-sensitivity drivers along with a new circuit design, making the potential noise sources inherently more complex. It was not a problem that could be resolved by simply adjusting a single parameter. Rather than focusing solely on the test station, we worked with the customer's audio team to investigate the issue from a system-level signal chain perspective. The process involved sequentially testing different shielding cables, adjusting grounding strategies, evaluating various Bluetooth dongle connection methods, and isolating potential power supply and electromagnetic interference sources within the test environment. Through continuous spectrum analysis and comparative testing, the scope of the issue was gradually narrowed. It was ultimately confirmed that the elevated noise floor was primarily related to power interference from the Bluetooth dongle, combined with differences in product behavior across operating states. After this conclusion was reached, relevant configurations were adjusted and validated on site. As a result, noise floor measurements returned to a stable and controllable range, allowing pilot production to proceed. Figure 2. Work with the customer engineer to solve problems Common Characteristics of Pilot Production Issues Looking back at these two pilot production experiences, it becomes clear that despite their different manifestations, the underlying diagnostic processes were quite similar. Whether dealing with airtightness instability or excessive noise, the root cause could not be isolated to a single module. Effective resolution required on-site evaluation across mechanical structure, materials, system operating states, and test conditions. During pilot production, issues of this nature rarely come with ready-made answers. They are also unlikely to be resolved through a single verification cycle. More often, progress is made through repeated trials, comparisons, and eliminations, gradually converging on a solution that is genuinely suitable for long-term production line operation. Production line delivery rarely follows a perfectly smooth path. In many cases, what ultimately determines whether a project can move forward as planned are those unexpected issues that must be addressed immediately when they arise. In our long-term collaboration with customers, our work often takes place at these critical moments—working alongside engineering teams to stabilize processes, maintain momentum, and keep projects moving forward step by step. If you also want CRYSOUND to support your production line, you can fill out the Get in Touch form below.
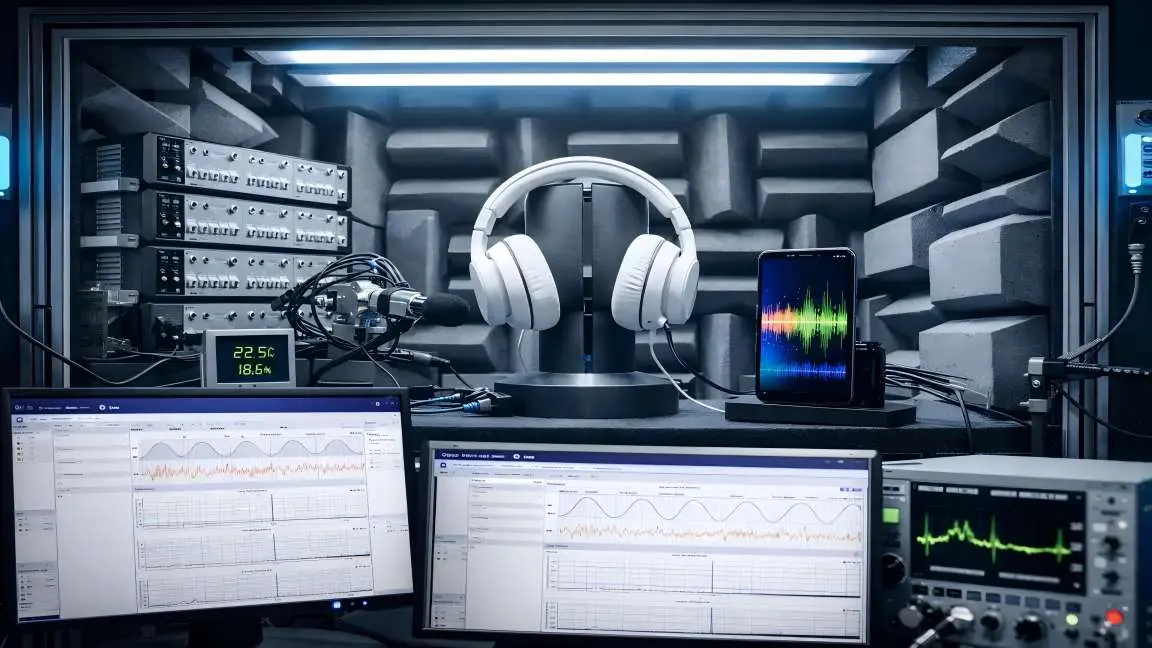
In our previous blog post, "Abnormal Noise Detection: From Human Ears to AI"we discussed the key pain points of manual listening, introduced CRYSOUND's AI-based abnormal-noise testing solution, outlined the training approach at a high level, and showed how the system can be deployed on a TWS production line. In this post, we take the next step: we'll dive deeper into the analysis principles behind CRYSOUND's AI abnormal-noise algorithm, share practical test setups and real-world performance, and wrap up with a complete configuration checklist you can use to plan or validate your own deployment. Challenges Of Detecting Anomalies With Conventional Algorithms In real factories, true defects are both rare and highly diverse, which makes it difficult to collect a comprehensive library of abnormal sound patterns for supervised training. Even well-tuned—sometimes highly customized—rule-based algorithms rarely cover every abnormal signature. New defect modes, subtle variations, and shifting production conditions can fall outside predefined thresholds or feature templates, leading to missed detections (escapes). In the figure below, we compare two wav files that we generated manually. Figure 1: OK Wav Figure 2: NG Wav You can see that conventional checks—frequency response, THD, and a typical rub & buzz (R&B) algorithm—can hardly detect the injected low-level noise defect; the overall curve difference is only ~0.1 dB. In a simple FFT comparison, the two wav files do show some discrepancy, but in real production conditions the defect energy may be even lower, making it very likely to fall below fixed thresholds and slip through. By contrast, in the time–frequency representation , the abnormal signature is clearly visible, because it appears as a structured pattern over time rather than a small change in a single averaged curve. Figure 3: Analysis results Principle Of AI Abnormal Noise Algorithm CRYSOUND proposes an abnormal-noise detection approach built on a deep-learning framework that identifies defects by reconstructing the spectrogram and measuring what cannot be well reconstructed. This breaks through key limitations of traditional rule-based methods and, at the principle level, enables broader and more systematic defect coverage—especially for subtle, diverse, and previously unseen abnormal signatures. The figure below illustrates the core workflow behind our training and inference pipeline. Figure 4: Algorithm Flow Principle During model training, we build the algorithm following the workflow below. Figure 5: Algorithm Judgment Principle How To Use And Deploy The AI Algorithm Preparation First, prepare a Low-Noise Measurement Microphone / Low-noise Ear Simulator and a Microphone Power Supply to ensure you can capture subtle abnormal signatures while providing stable power to the mic. Figure 6: Low-Noise Measurement Microphone Next, you'll need a sound card to record the signal and upload the data to the host PC. Figure 7: Data Acquisition System Third, use a fixture or positioning jig to hold the product so that placement is repeatable and every recording is taken under consistent conditions. Finally, ensure a quiet and stable acoustic environment: in a lab, an anechoic chamber is ideal; on a production line, a sound-insulation box is typically used to control ambient noise and keep measurements consistent. Figure 8: Anechoic Room Figure 9: Anechoic Chamber Model Development First, create a test sequence in SonoLab, select "Deep Learning" and apply the setting. Next, select the appropriate AI abnormal-noise algorithm module and its corresponding API Figure 10: Sequence Interface 1 Then open Settings and specify the model type, as well as the file paths for the training dataset and test dataset. Click Train and wait for the model to finish training (Training time depends on your PC's hardware) Figure 11: Sequence Interface 2 During training, the status indicator turns yellow. Once training is complete, it switches to green and shows a "Training completed" message. Figure 12: Sequence Interface 3 Finally, place your test WAV files in the specified test folder and run the sequence. The model will start automatically and output the analysis results. Test Case Figure 13:Test Environment Figure 14:Test Curve System Block Diagram Figure 15: System Block Diagram 1 Figure 16: System Block Diagram 2 Equipment More technical details are available upon request—please use the "Get in touch" form below. Our team can share recommended settings and an on-site workflow tailored to your production conditions.
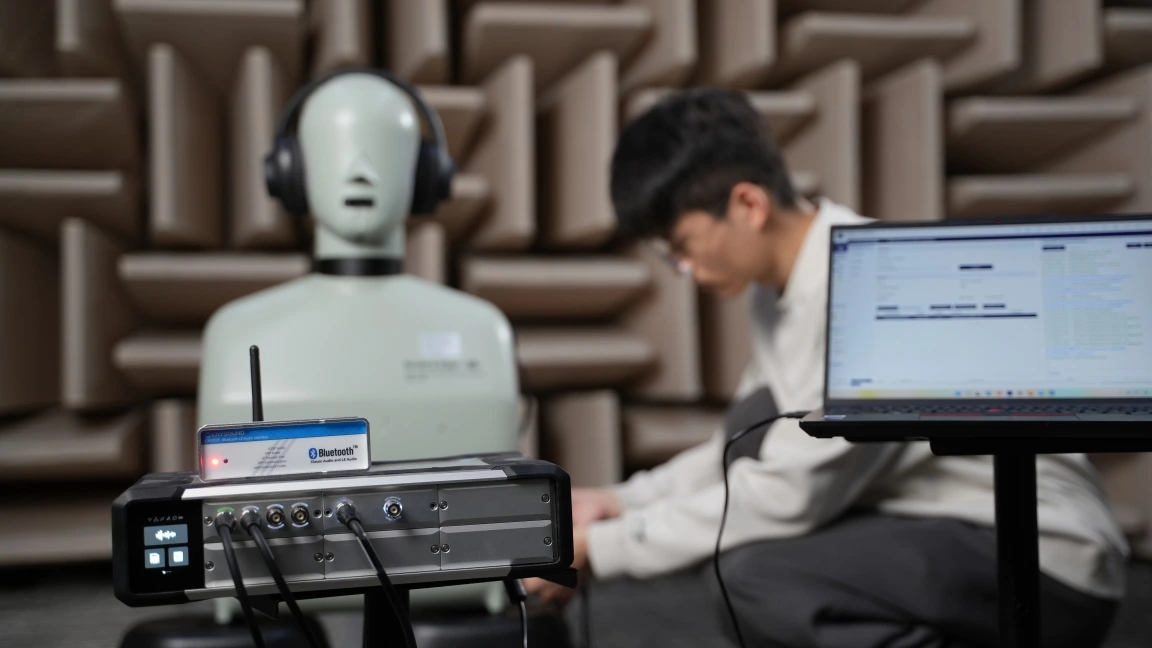
A2DP (Advanced Audio Distribution Profile) is the core Classic Bluetooth profile for high-quality audio streaming. This article provides an overview of how A2DP transmits music, explains its position in the Bluetooth protocol stack, and introduces a practical A2DP testing workflow using the CRY578 Bluetooth LE Audio Interface. How Does A2DP Transmit Music? A2DP is the core profile in Classic Bluetooth for the unidirectional transmission of high-quality audio streams. It primarily defines two roles: the audio Source and the audio Sink. A2DP and the Bluetooth Protocol Stack Thinking of A2DP as a high-speed logistics channel that "delivers" music from one device to another, the diagram above illustrates the division of responsibilities from the moment audio is generated to the point it is transmitted wirelessly. Figure 1 A2DP System Block Diagram At the top of the stack, the Application / Audio Source (or Audio Sink) layer acts as the "content factory" and "player". On the transmitting side, it obtains PCM audio data from the system and encodes it into Bluetooth-supported formats such as SBC or AAC. On the receiving side, it decodes the bitstream back into audio for playback. This layer directly determines the perceived audio quality—akin to the quality of raw materials and finished products—which users experience most intuitively. Below this is the A2DP Profile layer, which functions as a "cooperation agreement". It defines which device acts as the Source and which as the Sink, along with the supported codecs, sampling rates, and other parameters. The profile itself does not carry audio data; instead, it ensures both sides agree on "what format to use and how to transmit" before streaming begins. The next layer down is AVDTP, the "transport and scheduling control center". AVDTP is responsible for establishing and managing audio streams. It translates user actions—such as play, pause, and stop—into explicit protocol procedures and sends the encoded audio data over the media channel. The smooth operation of A2DP in practice largely depends on this layer. Below AVDTP is L2CAP, which acts as a standardized "containerized transport system". Both audio data and control information are segmented, encapsulated, reassembled, and multiplexed here. They are then delivered in an orderly fashion to the lower layers, ensuring stable and reliable transmission over a single Bluetooth link. At the bottom, the LMP, Baseband, and RF layers form the system’s “roads, vehicles, and radio infrastructure.” They handle device pairing, link management, and the actual wireless transmission, converting all upper-layer data into bitstreams over the Bluetooth air interface. Viewed from top to bottom, the A2DP protocol stack exhibits a clear downward flow: the upper layers focus on the audio content itself, while the lower layers handle wireless data delivery. This strict separation of responsibilities is what allows us to enjoy stable and continuous music playback through Bluetooth headphones. How to Test A2DP Functionality with CRY578? The CRY578 Bluetooth LE Audio Interface is CRYSOUND's latest test interface dedicated to Bluetooth audio and user-interface testing. Based on Bluetooth v5.4, the CRY578 supports both Classic Bluetooth and Bluetooth Low Energy audio simultaneously, making it suitable for use in both R&D laboratories and production-line testing. Building an A2DP Test Environment CRYSOUND provides a complete Bluetooth audio test solution, including both hardware and software, to support A2DP testing. In the CRYSOUND Bluetooth audio test system, the components are as follows: CRY578 acts as the Bluetooth Source, responsible for device discovery, connection, and audio transmission. DUT (Device Under Test) acts as the Bluetooth Sink, receiving, decoding, and playing the audio stream. B&K HATS simulates human acoustic characteristics, captures audio signals, and converts them into analog signals for the acquisition system. SonoDAQ + OpenTest (https://opentest.com) perform data acquisition and analysis, evaluating DUT performance based on the test results. Figure 2 Test System Block Diagram In this setup, the CRY578 can be controlled either via its PC software (Bluetooth LE Audio Interface) or through serial commands to scan for nearby Bluetooth devices and establish connections. Standard test signals—such as sweeps, noise, and distortion signals—are played from the PC. The acoustic output from the DUT is captured and analyzed by OpenTest to evaluate performance metrics such as frequency response, distortion, and signal-to-noise ratio. The CRY578 also supports switching to high-quality codecs such as AAC and LDAC, as well as multiple sampling rates, for comprehensive testing. A2DP Test Procedure Establish the Bluetooth Connection At the beginning of the test, a Bluetooth connection must be established between the CRY578 (acting as the A2DP Source) and the DUT (acting as the A2DP Sink). Figure 3 inquiry and connect The connection process includes device discovery and pairing, ACL link establishment, A2DP profile setup, and codec capability negotiation. Test Signal Generation from the Host PC Audio test software, such as OpenTest or SonoLab, generates standard signals like single-tone sine waves or sweeps. These signals are sent as PCM data to the CRY578 via a USB Audio Class (UAC) link. Figure 4 Test Scenario Audio Transmission via Bluetooth by CRY578 The continuous PCM audio stream is first segmented into fixed-size frames, which are then passed to an encoder (e.g., SBC or AAC) for compression, producing encoded frames. These frames are encapsulated into AVDTP media PDUs according to the A2DP specification. The PDUs are segmented and multiplexed by L2CAP, passed through the HCI interface to the Bluetooth controller, packaged as ACL packets at the baseband layer, and finally transmitted over the Bluetooth RF link. Decoding and Playback by the DUT The DUT performs the reverse process of the CRY578's transmission chain. The Bluetooth packets are decoded back into PCM data, which is then converted to analog signals by a DAC and output through the speaker. Acoustic Capture by B&K HATS The high-precision microphones built into B&K HATS capture the sound produced by the DUT and convert it into analog signals. Data Processing and Analysis with SonoDAQ + OpenTest SonoDAQ digitizes the analog signals and sends them to OpenTest. OpenTest then applies its internal algorithms to analyze the audio data and generate results—such as frequency response and distortion measurements. These results are then used to determine if the DUT meets the performance requirements. The Value of Bluetooth Protocol Analyzers in Testing During testing, audio data undergoes multiple digital-to-analog conversions, RF transmission, and acoustic-to-electrical conversion. An issue at any stage can affect the final test results. Once problems in the analog and digital signal paths have been ruled out, the root cause often lies in the Bluetooth RF transmission. In such cases, a Bluetooth protocol analyzer becomes an effective tool for pinpointing the exact issue. Figure 5 Capture Bluetooth packets using Ellisys If you are interested in Bluetooth audio testing, please visit CRY578 Bluetooth LE Audio Interface to learn more or fill out the Get in touch form below and we'll reach out shortly.
Valves are the "core control components" of pipeline systems. They perform four key functions—opening/closing, regulating, isolating, and directing—enabling precise control of fluid flow. Once sealing integrity fails, minor cases can lead to process upsets and energy losses, while severe cases may result in fires or explosions, toxic exposure, or environmental pollution. We built a valve leak application around the three things customers care about most on site—fewer missed detections and false alarms, better localization, and more reliable leak-rate estimation—by distilling them into an executable, traceable standardized workflow and closing the loop in the application for end-to-end deployment. Common Causes of Valve Internal Leakage What leads to valve leakage? We summarize it into the following four main causes: Normal wear and tear: Frequent opening and closing gradually wears the sealing surfaces; long-term scouring and erosion from the flowing medium can also degrade the seal fit. Process medium factors: Sulfur compounds and similar components in the medium can cause electrochemical corrosion; residual construction contaminants—such as sand, grit, and particles—can accelerate wear and scratch the sealing surfaces, leading to poor sealing. Improper operation and maintenance: Using an on/off valve for throttling, lack of routine cleaning and preventive maintenance, inadequate servicing, or improper/unsafe operation can all damage sealing surfaces or prevent full closure. Installation and management issues: Outdoor storage exposed to rain, ingress of mud and sand, and sandblasting/field conditions introducing grit or debris into the valve cavity can contaminate and scratch sealing surfaces, ultimately causing internal leakage. Figure 1. Illustration of Valve Internal Leakage When a valve is closed but the sealing surfaces do not fully mate, the pressure differential drives the medium to pass through small gaps from the high-pressure side to the low-pressure side, forming high-velocity micro-jets and turbulent flow. This leakage typically results in several observable signs, including sound/ultrasound, vibration, abnormal pressure behavior, and temperature anomalies or frosting. Figure 2. Symptoms of Valve Leakage Why Contact Ultrasound Works When a valve seal fails, high-pressure fluid passing through tiny gaps at the sealing surfaces generates turbulent flow, producing high-frequency ultrasonic signals in the 20–100 kHz range. The signal intensity is generally positively correlated with the leak rate—the larger the leak, the higher the amplitude. In the field, you can capture ultrasonic signals at measurement points upstream of the valve, on the valve body, and downstream, then apply algorithms to extract and analyze signal features to detect and localize internal leakage. Compared with traditional methods, temperature-based approaches are easily affected by heat conduction and are difficult to quantify; pressure-hold tests are time-consuming and poor at pinpointing the leak location; and listening by ear is inefficient, prone to missed detections and false alarms, and heavily dependent on individual experience. That's exactly why we launched this application—turning an experience-driven task into a standardized, process-driven workflow, supported by acoustics and data analytics. Figure 3. CRY8124 Acoustic Imaging Camera with IA3104 Contact Ultrasound Sensor Workflow and Key Capabilities More standardized workflow: turning on-site operation into guided testing In the CRY8124 valve leak application, the software features a standardized and visualized workflow. Operators follow on-screen prompts to place the contact ultrasound sensor on each measurement point in sequence and simply tap "Test". The results are displayed on the interface, and the algorithm automatically determines whether internal leakage is present after the test. Figure 4. Valve Leakage Detection Feature Page At the same time, the software provides standardized inputs for key parameters such as valve ID, valve type, valve size, medium type, and the upstream/downstream pressure differential. This means test results are easier to align across the same unit, different shifts, and different operators—making retesting and trend management much more consistent. Figure 5. Valve Leakage Detection Feature Page Smarter: automatic diagnosis + leak-rate estimation Our valve leak detection capability focuses on two key improvements: By analyzing the dB level at each measurement point and the features of the ultrasonic signal, the system automatically determines the internal leakage result based on algorithmic data, reducing reliance on manual interpretation. Built-in AI algorithms estimate the leak rate from ultrasonic features at the measurement points, providing a quantitative reference to support valve maintenance decisions. This is the core logic behind our emphasis on a "higher detection rate": when judgments rely less on subjective experience, missed detections and false alarms become far more controllable—especially in complex sites with many valves and multiple parallel branches. Application Scenarios Across different industries, there is a common need for valve leak detection: Figure 6: Application Scenarios Field Case Study Case : A Coal-to-Chemicals Plant in Inner Mongolia (Fuel Gas / Coal Gas System) Below is a real field test case of valve leak at a coal-chemical plant. Any internal leakage in fuel gas or coal gas systems can compromise isolation. If leakage exists, the downstream side may remain gas-charged, and the work area may still be exposed to risks of CO and sulfur-containing acid gases entering the zone—potentially leading to poisoning, fire, or even explosion hazards. Using contact ultrasonics, we performed on-site testing on the suspected valves, quickly identified the leakage points, and estimated the leak rate. This helped the customer turn "isolation confirmed" from an experience-based judgment into data-backed verification, prioritize corrective actions, reduce work risks caused by misjudged isolation, and ensure safer maintenance and stable operation. Figure 7. On-site Test Photos Valve type: Fuel gas compressor room bypass valve (butterfly valve). Test result: 19.8 L/min. Medium / pressure: Fuel gas (H₂, CO, CH₄), 3 MPa. Figure 8. Test Results Valve type: Fuel gas compressor room plug valve Test result: 1.7 L/min. Medium / pressure: Coal gas (mainly CO), 2.5 MPa. Figure 9. Test Results On-Site Test Method: Repeatable 5-Point Measurements Confirm Operating Conditions Ensure there is a pressure differential, and isolate interfering branches as much as possible. Key steps Close the valve to be tested. Open the upstream and downstream valves of the test section. Confirm a pressure differential between upstream and downstream gauges, and verify ΔP > 0.1 MPa. As shown in the figure below When testing Valve A for valve leakage: open Valves B and C, and close Valves A and D. When testing Valve B for valve leakage: open Valves A and C, and close Valves B and D. Figure 10. Valve Status Place Measurement Points (MP1–MP5) Cover upstream → valve core → downstream. MP3: Located at the valve core. MP2: Located 1–2 pipe diameters (D) upstream of the valve (place the point on the pipe wall away from the valve). MP1: Located upstream of the valve, 2–3D away from MP2. If space is limited, MP1–MP2 spacing can be shortened to 0.5D. MP4: Located 1D downstream of the valve (place the point on the pipe wall away from the valve). MP5: Located downstream of the valve, 1–2D away from MP4 (recommended on the pipe wall just after the valve flange). If space is limited, MP5–MP4 spacing can be shortened to 0.5D. D = pipe diameter Figure 11. Test Point Layout NoteFor small, flangeless threaded valves, the spacing between measurement points should be at least three pipe diameters (3D). Fugure12. Test Point Layout FAQ We've listed some common scenario-based questions about valve internal leakage to help you understand the application faster and choose the right solution more efficiently. Q1. How do I choose a Contact Ultrasound Sensor for pipelines at different temperatures? A1. We recommend the following sensor selection based on pipe surface temperature: For low-temperature pipes (below -20°C) or high-temperature pipes (above 50°C), use a needle-type Contact Ultrasound Sensor. For temperatures between -20°C and 50°C, use a ceramic Contact Ultrasound Sensor for signal capture. Q2. Which valves can be tested for valve leakage? A2. This method is suitable for valve leakage detection across a wide range of valve types, including: Gate valves Plug valves Globe valves Ball valves Check valves Butterfly valves Needle valves Pressure relief valves Pinch valves If your valve type is not listed above, please feel free to contact us. Q3. Can we still test if the valve and pipe are insulated? A3. If the insulation fully covers the valve and pipeline, testing may not be possible. You'll need to remove the insulation at the measurement area, or leave an opening of about 7 cm in diameter so the Contact Ultrasound Sensor can directly contact the pipe wall to capture the signal. Q4. What should we pay attention to regarding the pipe surface during data collection? A4. The Contact Ultrasound Sensor must make good contact with a solid surface to reliably capture ultrasonic signals propagating through the pipe. Large particles or debris between the sensor and the pipe surface can lead to inaccurate results. If the pipe wall is rusty, wipe off any large dust or loose particles on the surface before testing. Contact Us If you'd like to learn more about how CRYSOUND acoustics can be applied to valve leak detection, or if you want a more suitable inspection solution based on your on-site process conditions and acceptance criteria, please contact us via the form below. Our engineers will get in touch with you.
Negative-pressure airtightness is critical for high-speed train car bodies, and even minor leaks can lead to rework or delivery risks. This article presents a case from Changchun where CRYSOUND’s CRY8124 Acoustic Imaging Camera was used to quickly, intuitively, and verifiably pinpoint leaks on a carbon-fiber train car body shell, showcasing the CRY8124’s application in vacuum leak detection for carbon-fiber high-speed train car bodies. Case Snapshot Year: 2025 Location: Changchun Workpiece: Carbon-fiber train car body shell Test condition: Vacuum/negative-pressure setting; 15-minute pressure-hold test Sample size: 4 units Coverage: Scanned 6 key areas (car-body section joints/seams, structural interfaces, process holes, corners/curved transition areas, edge of cover film, around embedded components, etc.) Participants: CRYSOUND's Technical Engineers Deliverables: Acoustic imaging heatmap images/videos + report Project Background: Vacuum Leaks Are “Hard to Find, Time-Consuming, and Easy to Miss” Carbon-fiber car body shells feature complex structures with numerous joints and interfaces. When a leak exists during negative-pressure testing, traditional methods often face three common challenges: Experience-dependent localization: Requires repeated “listen–feel–try” steps, and heavily depends on operator skill and experience. High interference: Background noise from workshop fans, tools, friction, and impacts can mask weak leak signals. Inconsistent efficiency: Troubleshooting time varies significantly between operators for the same issue, making verification difficult. On-Site Approach: Pinpointing Leaks with “Visible Sound” In this project, CRY8124 Acoustic Imaging Camera was used to perform scan-based inspections across key areas of the shell. The core value of acoustic imaging lies in making the sound source generated by a leak visible on the screen—turning leak localization from “guessing” into “seeing.” On-Site Inspection Procedure: Maintain the negative-pressure condition: Troubleshooting was performed under the customer’s specified negative-pressure (vacuum gauge pressure approx. -100 kPa) test state. Selected frequency range: Based on on-site verification, 20–40 kHz was selected (offset from the dominant background-noise frequencies, providing better contrast for leak sources). Selected imaging threshold: Based on on-site verification, an imaging threshold of -40 dB was selected Scan and locate: Move the device along high-risk areas such as seams, interfaces, corners, and the edges of cover films. Point verification: Re-test suspected sound-source points at close range and mark them; adjust angles as needed for confirmation (strong airflow, film vibration, or strong reflections may create false leak indications, so multi-angle rechecks are required). Evidence output: Save images/videos with acoustic heatmap overlays to support on-site closure and quality documentation. Reports can later be generated using CRYSOUND’s second-generation analysis software. Inspection Results: Multiple Leaks Quickly Identified Under the customer’s specified negative-pressure test conditions at a train manufacturing site in Changchun, acoustic imaging scan inspections were carried out on a carbon-fiber train car body shell. Multiple vacuum leak points identified: A total of three suspected leak points were marked. Rechecks were performed using a temporary sealing (blocking) comparison method. After the leak points were sealed, there was no measurable pressure drop, confirming three leak points. All confirmed points were marked on-site, and images/videos with the leak heatmap overlays were saved for quality documentation and verification. Efficiency: On average, the total inspection time per component—from “start scanning” to “finish inspection, marking, and saving evidence / completing verification”—was under 10 minutes. Closed-loop validation: After corrective actions, a re-inspection was performed under the same conditions. The leak heatmap disappeared, and the workpiece passed the customer’s pressure-hold specification. From the on-site inspection visuals, different leak points consistently appeared as stable acoustic heatmap overlays on the device interface. Why Is Acoustic Imaging Well Suited for This Process? From the perspective of airtightness testing for composite structures, vacuum leak detection is not short of methods that can “find a problem.” The real challenge is achieving results that are fast, accurate, visual, and verifiable. In composite car-body applications, the advantages of acoustic imaging mainly include: Visual localization: Leak points are overlaid directly onto the surface of the structure as acoustic heatmaps, making the leak location visible and reducing communication and handoff costs. Stronger resistance to environmental interference: By selecting an appropriate frequency range and setting the imaging threshold, the contrast between leak sources and background noise is improved, minimizing the impact of ambient interference on results. More controllable efficiency: As a handheld tool, the cycle time is more consistent, making it suitable for batch inspections and production-line management. Traceable evidence: Images and videos can be retained for review, quality traceability, and training purposes. Practical Tips: How to Be “Faster and More Accurate” On Site Based on our on-site experience in Changchun, here are three actionable recommendations: Prioritize high-risk geometries: seams, hole edges, corners, cover-film edges, and interface transition areas. Image first, then verify up close: use the device to identify suspected leak points first, then confirm them at close range and from multiple angles. Standardize the documentation template: save images/videos for every point to support corrective actions, test report writing, and follow-up verification. Conclusion: Turning Troubleshooting from “Experience-Based Work” into a Standardized Process” In vacuum leak detection for carbon-fiber train car body shells, CRY8124 Acoustic Imaging Camera upgrades “listening for leaks” into visualized localization, delivering a closed-loop outcome with higher efficiency, clearer pinpointing, and retained evidence—while significantly reducing reliance on individual experience. If you’d like to learn more about the application of CRY8124 Acoustic Imaging Camera for vacuum leak testing, or discuss a detection solution better suited to your composite-material process and acceptance criteria, please contact us via the form below. Our sales or technical support engineer will get in touch with you.
In this article, we use a wind turbine blade factory as an example to show how CRY8124 Acoustic Imaging Camera can help complete a vacuum (negative-pressure) integrity test for a single blade in about 10 minutes. What Is a Wind Turbine Blade? Wind turbine blades are the key rotor components that convert wind energy into mechanical power, which is then turned into electricity by the generator. They are typically made of glass-fiber or carbon-fiber composite materials and offer a high strength-to-weight ratio and strong corrosion resistance. The wind turbines you see on mountain ridges, in deserts, or along coastlines rely on these large blades to capture energy efficiently. Why Vacuum Bag Integrity Testing Matters in Vacuum Infusion In wind turbine blade manufacturing, vacuum bag airtightness during the vacuum infusion process is critical for stable vacuum levels and consistent laminate quality. Even small leaks can lead to process instability, additional troubleshooting time, and rework risk. A typical workflow looks like this: 1. Preparation: Lay auxiliary materials (release fabric, flow media), seal the blade with vacuum film, block openings with sealing tape, and connect the vacuum pump, lines, and a gauge. 2. Evacuate to target vacuum: Start the pump and ramp to the process-defined vacuum level. If the target cannot be reached or keeps drifting, check high-risk areas first (especially sealant joints). 3. Vacuum hold & leak check: After reaching the specified vacuum level, turn off the pump and begin the hold phase (typically 10–30 minutes). Confirm the vacuum loss stays within your acceptance limit. If there is a leak, the vacuum level will drop noticeably—locate the leak point and repair it promptly. 4. Repair, re-test, document: Mark the leak points, replace any damaged vacuum film, and reseal the leaking areas. After repair, repeat evacuation and the vacuum hold test until the system meets the acceptance criteria, then document the results before proceeding to the next step. Common Challenges in Wind Turbine Blade Vacuum Bag Testing A single blade can be 60–100 m long, creating a large sealing perimeter—so leak hunting can push the test beyond 30 minutes. Dense laminate around the blade root makes leaks harder to locate with traditional methods. Manual checks are slow and operator-dependent, leading to inconsistent results across shifts. Case Study: Faster Leak Localization and Lower Rework Cost At one blade manufacturer, routine vacuum-hold tests after bagging sometimes failed the hold criteria, leading to repeated troubleshooting and rework. The team introduced the CRY8124 Acoustic Imaging Camera as an assistive tool to locate leaks faster during pre-infusion checks. Recommended Settings (Example) Turn on the CRY8124 and select the vacuum/leak scenario. Set the acoustic imaging band to 20–40 kHz. Adjust the imaging threshold (-40 dB to 120 dB) based on on-site conditions to reduce background noise from fans, cutting machines, and vacuum pumps. If ambient noise is high, enable focus/beamforming mode to further suppress environmental noise. On-Site Leak Scanning Workflow During inspection, the operator walks along key areas—such as the pressure side (PS), suction side (SS), the main-spar region, and around the root preform—while holding the CRY8124 Acoustic Imaging Camera. When a leak is present, the device overlays an acoustic “cloud map” on the live video feed, helping pinpoint the leak location and reducing repeated manual checks. Measured Impact (Customer-Reported) After introducing the CRY8124 Acoustic Imaging Camera, the average vacuum bag check time per blade dropped from 30+ minutes to around 10 minutes (about a 70% reduction in check time). The customer also reported annual cost savings exceeding $10,000 by reducing rework and scrap. How a 10-Minute Vacuum Bag Check Is Achieved The CRY8124 Acoustic Imaging Camera is designed for fast scanning across common blade inspection zones (PS/SS surfaces, main spar region, and the blade root). It provides a visual indication of leak location and relative leak severity, while using frequency filtering and beamforming to work in noisy production environments. With a high-density microphone array (up to 200 microphones, depending on configuration) covering 2 kHz–100 kHz, the system can capture ultrasonic components from small leaks and render them as an intuitive acoustic image. If you’d like to learn more about acoustic imaging for vacuum leak detection—or discuss your blade process and inspection targets—please use the “Get in touch” form below. Our team can share recommended settings and an on-site workflow tailored to your production conditions.

Within the intricate tapestry of electrical systems, where the paramount significance of ensuring power distribution safety and reliability cannot be overstated, the swift detection and mitigation of partial discharge (PD) emerge as critical elements in averting equipment degradation and voltage instabilities. Acknowledging this pressing need, our discerning clients frequently seek insights into the practical applications of acoustic imaging technology to address PD challenges. In response to this demand, the CRYSOUND team takes pride in presenting a series of compelling case studies that highlight the precise utilization of acoustic imaging cameras across two pivotal domains: substations and power distribution systems. Application Scene: Electricity Substations 1. Switchgear The acoustic imaging camera efficiently detects partial discharge on switchgear cabinets via the inspection port. It aids personnel in confirming faults, minimizing downtime, and enhancing operational safety. 2. Wire The acoustic imaging camera excels in detecting subtle partial discharge in 110kV cables, ensuring early detection of potential issues. Its advanced technology facilitates swift identification of weak points, empowering proactive maintenance. 3. High Voltage Room Insulator Safety reigns supreme within high-voltage chambers. The handheld acoustic imaging camera provides a secure solution, enabling the precise detection of anomalies in insulators and equipment while maintaining safe distances. By leveraging this tool, risks to personnel are mitigated, and reliable power distribution is ensured. 4. Switch Insulator Surface discharge incidents often occur on the porcelain pillars of switch cabinets. Acoustic imaging camera empower inspection teams to swiftly and precisely evaluate component performance, promptly identifying hazards. Application Scene: Power Distribution System 1. Tower Insulator The acoustic imaging camera remotely identifies abnormal discharges from distribution line insulators, facilitating early detection. Its precision ensures proactive mitigation of potential issues, enhancing grid reliability and safety. 2. Cable Distribution Box Complex T-joints and busbar connections with high impedance are susceptible to discharge. Our acoustic imaging cameras simplify the identification of partial discharge, enabling precise localization and facilitating proactive maintenance to maximize grid stability and safety. 3. Drop Fuse Defective fuses threaten system stability. CRYSOUND acoustic imaging camera promptly pinpoints partial discharge, facilitating prompt response. 4. Support Insulator Continuous partial discharge in insulators erodes insulation properties. The height of support insulators hinders routine inspections. The CRYSOUND acoustic imaging camera enables safe, remote assessment, ensuring insulator integrity anduninterrupted power flow. Partial discharge silently jeopardizes the safety and reliability of electrical systems. Rapid and precise identification of fault areas through acoustic imaging cameras is imperative for accident prevention and upholding the integrity of power systems. Leveraging the capabilities of acoustic imaging cameras guarantees the security and reliability of our electrical infrastructure. For further information or to avail of our professional services, please do not hesitate to contact us. We are committed to providing effective solutions tailored to your needs!


