This article introduces how to build a multi-channel sound level meter compliant with IEC 61672-1 using OpenTest, in combination with SonoDAQ data acquisition hardware and measurement-grade microphones.
The system supports A / C / Z frequency weighting, F / S / I time weighting, and standard acoustic quantities such as Lp, Leq, and Ln, making it suitable for a wide range of applications including environmental noise, product noise, and automotive NVH testing.
From Handheld Sound Level Meters to Multi-Channel Sound Level Measurement Platforms
In acoustics and vibration testing, one fundamental question appears in almost every project: “How loud is it?”
From office equipment and household appliances to automotive NVH and industrial machinery, regulations, standards, and internal quality criteria all rely on quantitative evaluation of Sound Pressure Level (SPL).
Traditionally, this is done using a handheld sound level meter compliant with IEC 61672, placed at a specified position to read an A-weighted sound level for compliance checks and quality verification.
IEC 61672 defines detailed requirements for sound level meters in terms of frequency weighting, time weighting, linearity, self-noise, and dynamic range, and classifies instruments into Class 1 and Class 2, with Class 1 having stricter requirements and being suitable for laboratory and type-approval testing.
As product structures and test requirements evolve, engineers increasingly expect more than what a single handheld meter can offer:
- Measure multiple positions simultaneously to compare different locations or operating points
- Combine sound level data with spectra and octave-band analysis to quickly identify problematic frequency regions
- Synchronize sound level measurement with speed, vibration, temperature, and other physical quantities for NVH diagnostics
- Integrate sound level measurement into automated and batch test workflows, rather than relying on manual spot checks
This leads to the demand for multi-channel sound level meters: systems that not only meet IEC 61672-1 Class 1 accuracy requirements, but also provide multi-channel capability, scalability, and automation.
OpenTest, developed by CRYSOUND, is a new-generation acoustic and vibration test platform. Its dedicated Sound Level Measurement module, combined with CRY5820 SonoDAQ Pro front-end hardware and measurement microphones, enables multi-channel sound level measurements consistent with Class 1 sound level meters.
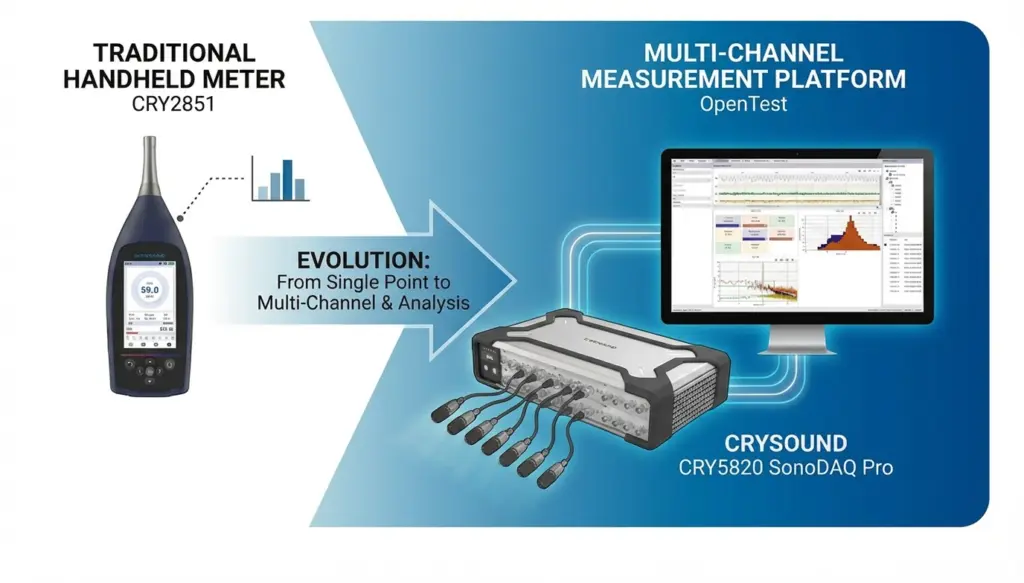
Figure 1. From handheld sound level meters to multi-channel sound level measurement platforms
IEC 61672: What Are We Actually Measuring?
Meaning of Sound Pressure Level (Lp)
Sound Pressure Level (SPL) is a logarithmic measure of the root-mean-square sound pressure prms relative to the reference pressure p0, which is 20 μPa in air, defined as:
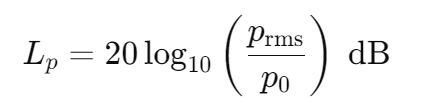
When prms=1 Pa, the SPL is approximately 94 dB, which is why 94 dB / 1 kHz is commonly used as the reference level for acoustic calibrators.
Frequency Weighting: A / C / Z
Human hearing sensitivity varies with frequency. IEC 61672 requires all sound level meters to support A-weighting, while Class 1 instruments must also support C-weighting. Z-weighting (Zero weighting, i.e. flat response) is optional.
- A-weighting (dB(A))
Based on the 40-phon equal-loudness contour, with significant attenuation at low and very high frequencies. It is widely used in regulations and standards as an indicator correlated with perceived loudness. - C-weighting (dB(C))
Much flatter than A-weighting, with less low-frequency attenuation. It is suitable for evaluating peak levels, mechanical noise, and high-level events. - Z-weighting (dB(Z))
Essentially flat within the specified bandwidth, preserving the original spectral energy distribution, and useful for detailed analysis.
While A-weighting dominates regulations, it is not a perfect psychoacoustic model. In cases involving strong low-frequency content, modulation, or tonal components, A-weighted levels may underestimate perceived annoyance.
For design and diagnostic work, it is therefore recommended to combine C/Z weighting, octave-band spectra, and sound quality metrics.
Time Weighting: Fast / Slow / Impulse
IEC 61672 defines the following time weightings:
- F (Fast): time constant ≈ 125 ms, suitable for rapidly fluctuating sound levels
- S (Slow): time constant ≈ 1 s, suitable for observing overall trends
- I (Impulse): designed for impulsive signals, more sensitive to short-duration peaks
Common sound level descriptors include:
- LAF / LAS / LAI: A-weighted sound levels with Fast / Slow / Impulse time weighting
- LCpeak: C-weighted peak sound level
Energy-Based and Statistical Quantities: Leq, SEL, Ln
IEC 61672 also defines commonly used acoustic quantities:
- Leq,T / LAeq,T
Equivalent continuous sound level over a time period T, widely used in environmental and product noise evaluation. - Sound exposure and sound exposure level: E, LE / LAE (SEL)
Represent the total sound energy of an event, commonly used for aircraft, traffic, and single-event noise evaluation. - Lmax / Lmin: Maximum and minimum sound levels under a specified time weighting
- Lpeak (typically LCpeak): Peak sound level based on peak sound pressure
- Statistical levels Ln (L10, L50, L90, etc.)
Levels exceeded for n% of the measurement time, commonly used in environmental noise analysis.
Band Levels: Octave and 1/3-Octave Bands
Although octave-band filters are specified in IEC 61260, IEC 61672 aligns with them in terms of frequency response and standard center frequencies. Common analyses include:
- 1-octave band levels (e.g. 31.5 Hz–16 kHz)
- 1/3-octave band levels, offering finer frequency resolution for identifying narrow-band noise and structural resonances
Together, these quantities define the full scope of sound level measurement—from instantaneous readings to time-averaged values, and from broadband levels to frequency-resolved analysis.
Sound Level Measurement with OpenTest
Setup: Building the Signal Chain from Source to Software
Hardware Preparation
- Data acquisition front-end
For example, CRY5820 SonoDAQ Pro, a modular multi-channel data acquisition system supporting 4–24 channels per unit and scalable to thousands of channels. It features 32-bit ADCs, up to 170 dB dynamic range, 1000 V channel isolation, and ≤100 ns PTP/GPS synchronization accuracy, suitable for both laboratory and field acoustic and vibration testing. - Sensors
One or more measurement-grade microphone sets (with preamplifiers), positioned at representative measurement or listening locations. - Computer and software
A PC with OpenTest installed and the Sound Level Measurement module licensed.
Connecting Devices and Channels in OpenTest
- Launch OpenTest and create a new project.
- In Hardware Settings, click “+”; available devices (including those connected via openDAQ or ASIO) are automatically detected.
- Select the required acquisition devices (e.g. SonoDAQ) and add them to the project.
- In Channel Settings, add the microphone channels and configure sampling rate and input range.
At this point, the signal chain Sound source → Microphone → DAQ → OpenTest is fully established.
Calibration: Setting the Acoustic Reference
To ensure absolute accuracy, each channel must be calibrated using a Class 1 acoustic calibrator.
- Open the Calibration dialog in OpenTest.
- Select the microphone channels to be calibrated.
- Mount the calibrator on the microphone and start calibration.
- Once the reading stabilizes, complete the calibration.
OpenTest automatically updates the channel sensitivity so that the 94 dB SPL reference point is aligned.
For comparison tests, a handheld sound level meter (e.g. CRY2851) can be calibrated using the same calibrator (e.g. CRY3018) to ensure both systems share the same acoustic reference.
Measurement: Acquiring Sound Level Time Histories
Switch to the Sound Level Meter module in OpenTest and select:
- Measurement channels
- Quantities to compute (Lp, Leq, Ln, etc.)
- Frequency weighting (A / C / Z, computed simultaneously)
Typical operating conditions may include:
- Idle
- Typical load
- Full load
For each condition:
- Stabilize the DUT at the target operating state.
- Start measurement in OpenTest.
- Monitor sound level time histories, octave-band plots, and FFT spectra in real time.
- Stop after sufficient duration and name the dataset accordingly.
Each measurement is automatically saved as a dataset for later comparison and analysis.
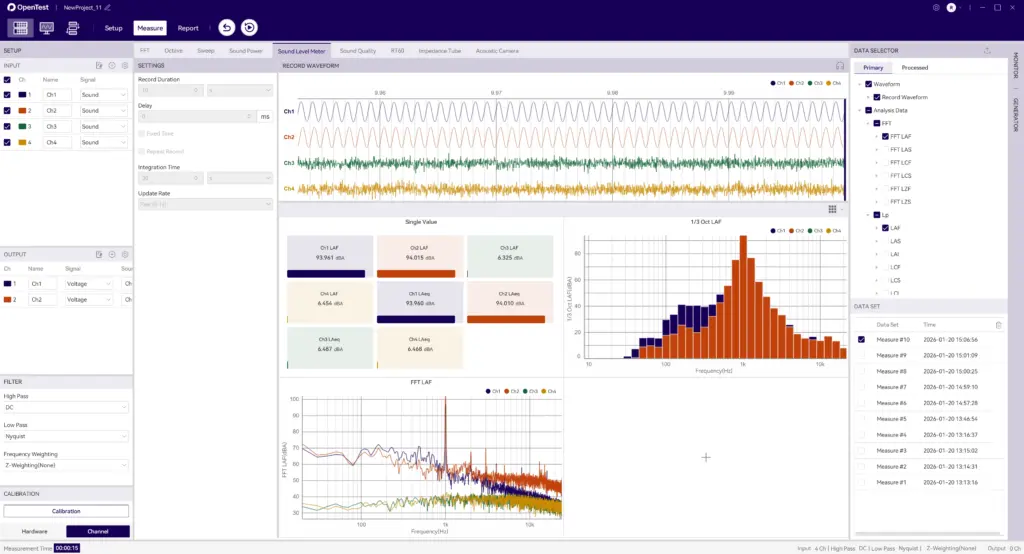
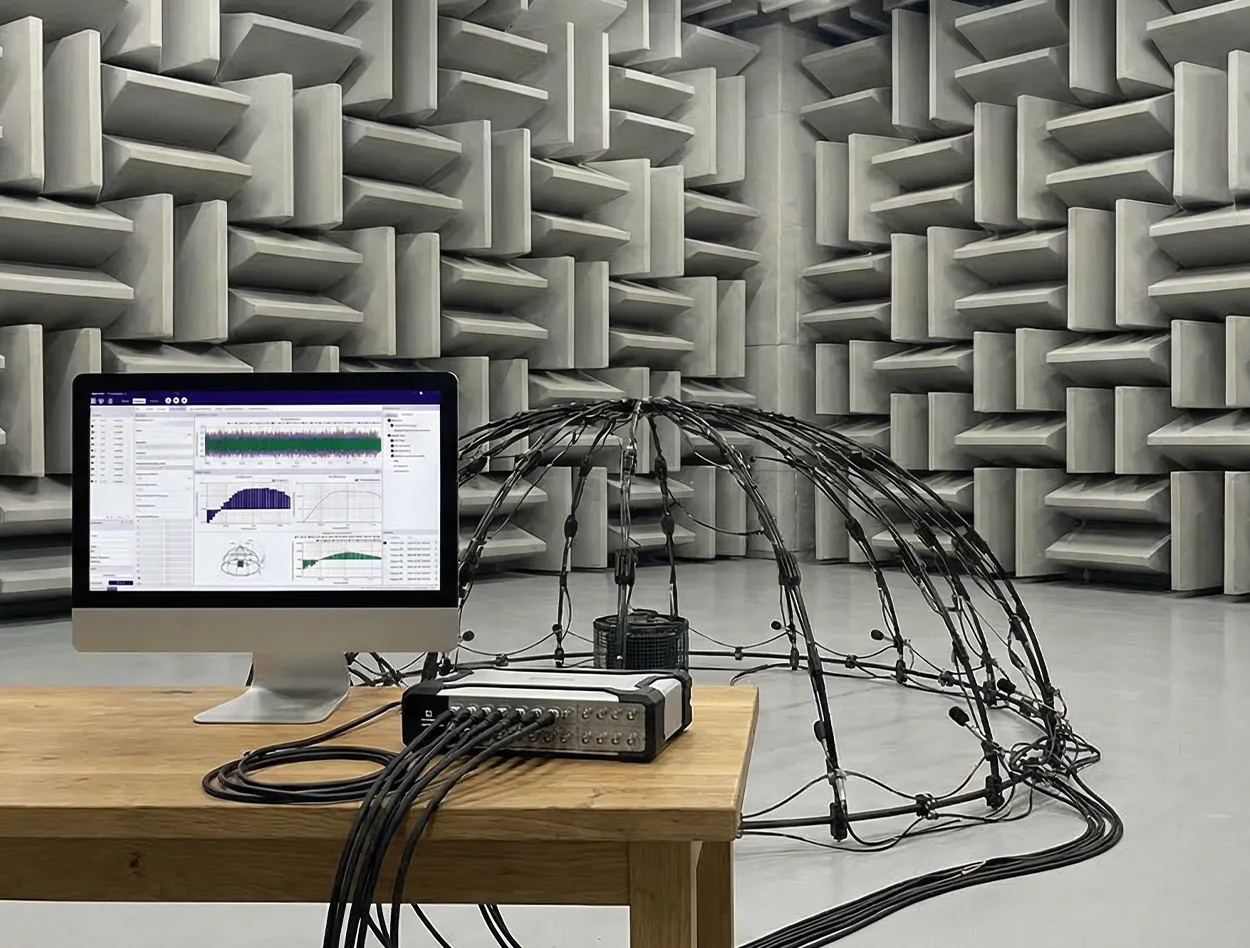
Figure 2. Multi-channel sound level measurement using OpenTest
Reporting: From Data to Traceable Documentation
After measurements, OpenTest’s reporting function can be used to generate structured reports:
- Project information, DUT details, operating conditions
- Selected acoustic quantities (Leq, Lmax, LCpeak, Ln, etc.)
- Company logo and test personnel information
Raw waveforms and analysis results can also be exported for archiving or further processing.
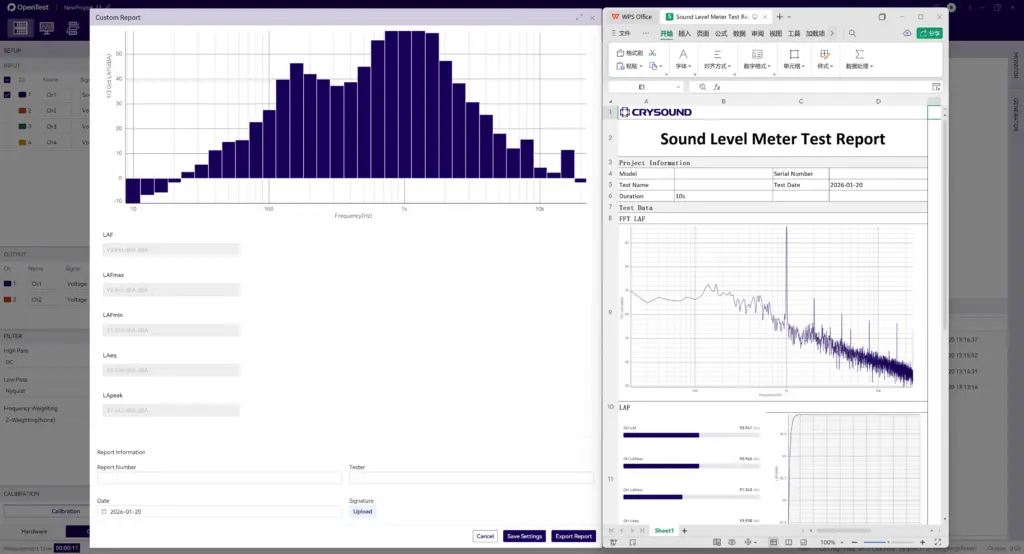
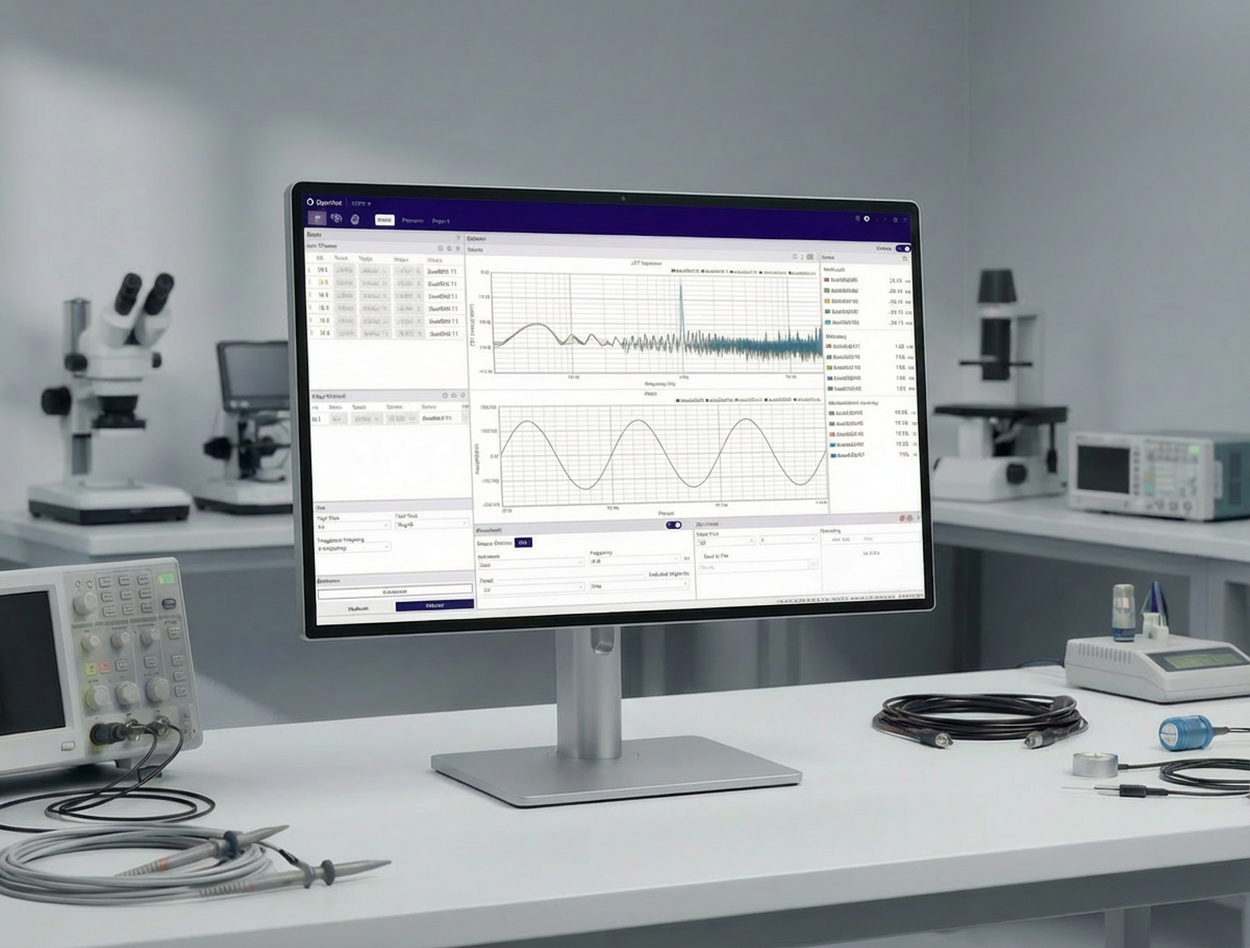
Figure 3. OpenTest sound level measurement report
Comparison with CRY2851 Handheld Sound Level Meter
CRY2851 is a Class 1 sound level meter compliant with IEC 61672-1:2013, supporting A/C/Z weighting, F/S/I time weighting, and a full set of acoustic parameters.
Comparison procedure:
- Environment and operating conditions
Low-background laboratory or semi-anechoic room; multiple operating states. - Calibration consistency
Both systems calibrated with the same Class 1 calibrator (94 dB or 114 dB at 1 kHz). - Sensor placement and acquisition
Microphones positioned as closely as possible at the same measurement point. - Result comparison
Compare LAeq, LAF, LCpeak, and other key parameters under identical weighting and time windows.
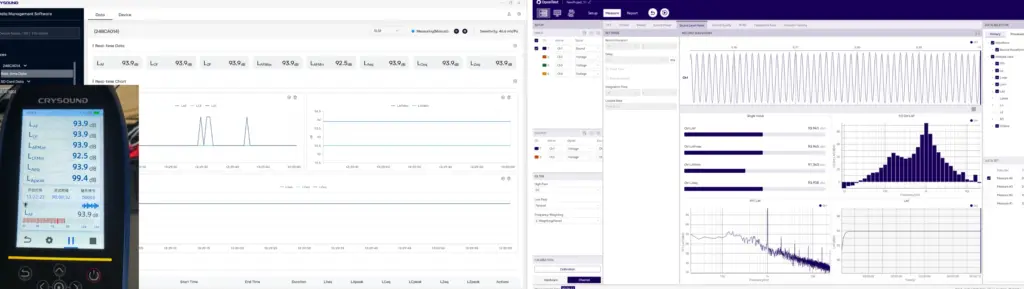
Figure 4. CRY2851 vs. OpenTest multi-channel sound level measurement
Typical Applications of the Sound Level Measurement Module
Consumer Electronics / IT Equipment
- Evaluate the impact of cooling strategies on LAeq and LAFmax
- Combine sound level limits with sound power measurements
- Integrate FFT, 1/3-octave, and sound quality metrics
Automotive NVH / Interior Acoustics
- Multi-position sound level measurement in the cabin
- Comparison across driving conditions
- Coupling with order analysis and sound quality modules
Household Appliances and Industrial Machinery
- Supplement sound power tests with multi-point sound level monitoring
- Integrate into production lines using sequence mode
- Identify problematic frequency bands via 1/3-octave analysis
Environmental and Long-Term Monitoring
- Multi-point statistical sound level evaluation (L10, L50, L90)
- Long-term data logging and remote access
If you are already familiar with handheld sound level meters, the OpenTest Sound Level Measurement module effectively upgrades them into a system that is:
- Multi-channel
- Traceable (raw data + analysis + reports)
- Expandable, working seamlessly with sound power, sound quality, FFT, and octave-band analysis modules, and supporting automated test workflows.
Welcome to fill in the form below ↓ to contact us and book a demo and trial of the OpenTest Sound Level Meter module. You can also visit the OpenTest website at www.opentest.com to learn more about its features and application cases.